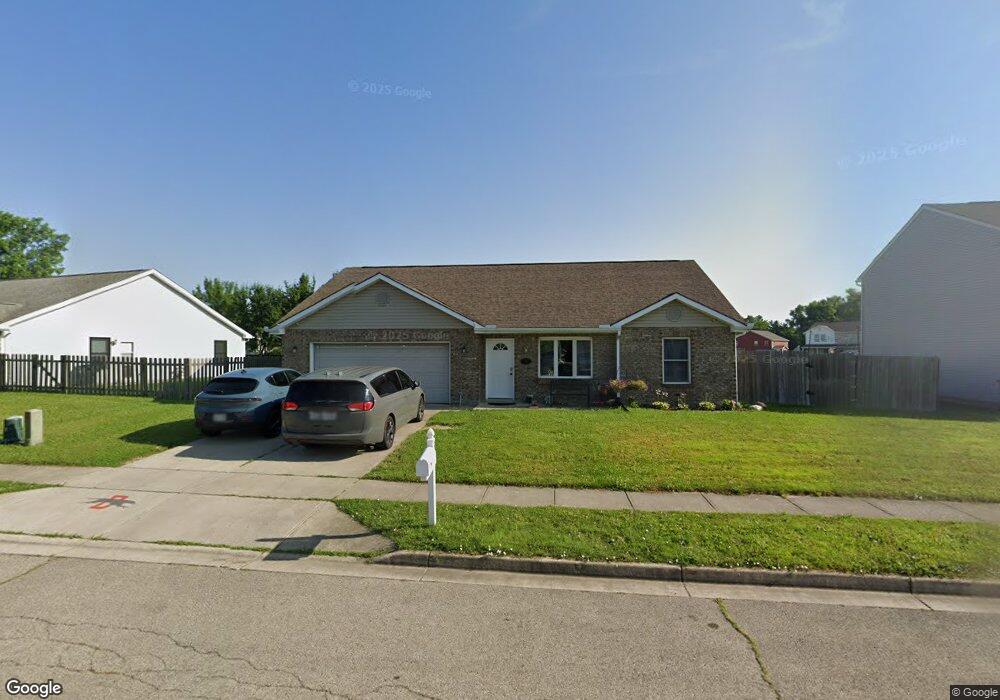
81 Tarragon Way New Lebanon, OH 45345
Estimated Value: $205,810 - $261,000
3
Beds
2
Baths
1,519
Sq Ft
$157/Sq Ft
Est. Value
About This Home
This home is located at 81 Tarragon Way, New Lebanon, OH 45345 and is currently estimated at $239,203, approximately $157 per square foot. 81 Tarragon Way is a home located in Montgomery County with nearby schools including Dixie Elementary School, Dixie Middle School, and Dixie High School.
Ownership History
Date
Name
Owned For
Owner Type
Purchase Details
Closed on
Nov 15, 2007
Sold by
Fannie Mae
Bought by
Himan Joshua and Himan Melissa
Current Estimated Value
Home Financials for this Owner
Home Financials are based on the most recent Mortgage that was taken out on this home.
Original Mortgage
$23,100
Outstanding Balance
$14,683
Interest Rate
6.47%
Mortgage Type
Stand Alone Second
Estimated Equity
$224,520
Purchase Details
Closed on
Aug 14, 2007
Sold by
Smith Nicholas R and Estate Of Karen L Smith
Bought by
Federal National Mortgage Association
Purchase Details
Closed on
Aug 30, 2005
Sold by
Ulrich Joseph L and Ulrich Stephanie T
Bought by
Smith Karen L
Home Financials for this Owner
Home Financials are based on the most recent Mortgage that was taken out on this home.
Original Mortgage
$128,000
Interest Rate
5.37%
Mortgage Type
Fannie Mae Freddie Mac
Purchase Details
Closed on
May 16, 2005
Sold by
Jr Robinson & Stella Robinson Ltd
Bought by
Ulrich Joseph L
Create a Home Valuation Report for This Property
The Home Valuation Report is an in-depth analysis detailing your home's value as well as a comparison with similar homes in the area
Home Values in the Area
Average Home Value in this Area
Purchase History
| Date | Buyer | Sale Price | Title Company |
|---|---|---|---|
| Himan Joshua | $115,500 | None Available | |
| Federal National Mortgage Association | $104,000 | None Available | |
| Smith Karen L | $160,000 | -- | |
| Ulrich Joseph L | $29,000 | Midwest Abstract Company |
Source: Public Records
Mortgage History
| Date | Status | Borrower | Loan Amount |
|---|---|---|---|
| Open | Himan Joshua | $23,100 | |
| Open | Himan Joshua | $92,400 | |
| Previous Owner | Smith Karen L | $128,000 |
Source: Public Records
Tax History Compared to Growth
Tax History
| Year | Tax Paid | Tax Assessment Tax Assessment Total Assessment is a certain percentage of the fair market value that is determined by local assessors to be the total taxable value of land and additions on the property. | Land | Improvement |
|---|---|---|---|---|
| 2024 | $2,790 | $48,750 | $11,240 | $37,510 |
| 2023 | $2,790 | $48,750 | $11,240 | $37,510 |
| 2022 | $3,343 | $45,400 | $10,500 | $34,900 |
| 2021 | $3,308 | $45,400 | $10,500 | $34,900 |
| 2020 | $3,232 | $45,400 | $10,500 | $34,900 |
| 2019 | $2,816 | $35,400 | $10,500 | $24,900 |
| 2018 | $2,825 | $35,400 | $10,500 | $24,900 |
| 2017 | $2,778 | $35,400 | $10,500 | $24,900 |
| 2016 | $2,507 | $33,550 | $10,500 | $23,050 |
| 2015 | $2,622 | $33,550 | $10,500 | $23,050 |
| 2014 | $2,622 | $37,000 | $10,500 | $26,500 |
| 2012 | -- | $32,040 | $11,900 | $20,140 |
Source: Public Records
Map
Nearby Homes
- 630 Holderman Place
- 107 Laredo Ave
- 448 Gregory Ave
- 431 Avon Oak Ct
- 221 Mills Place
- 432 Scarborough Ct
- 231 S Church St
- 213 S Church St
- 660 Cranwood Cir
- 136 Bronwood St
- 0 Dayton Eaton Pike Unit 1834498
- 2135 Dayton Eaton Pike
- 109 E Main St
- 101 E Weaver St
- 115 N Clayton Rd
- 224 Drina Ave
- 306 N Clayton Rd
- 1833 Guntle Rd
- 1204 Sizemore Ct
- 10701 Old Dayton Rd
- 71 Tarragon Way
- 91 Tarragon Way
- 101 Tarragon Way
- 615 Holderman Place
- 605 Holderman Place
- 625 Holderman Place
- 60 Tarragon Way
- 80 Tarragon Way
- 50 Tarragon Way
- 31 Tarragon Way
- 70 Tarragon Way
- 40 Tarragon Way
- 595 Holderman Place
- 620 Holderman Place
- 610 Holderman Place
- 600 Holderman Place
- 30 Tarragon Way
- 580 Holderman Place
- 21 Tarragon Way
- 570 Holderman Place