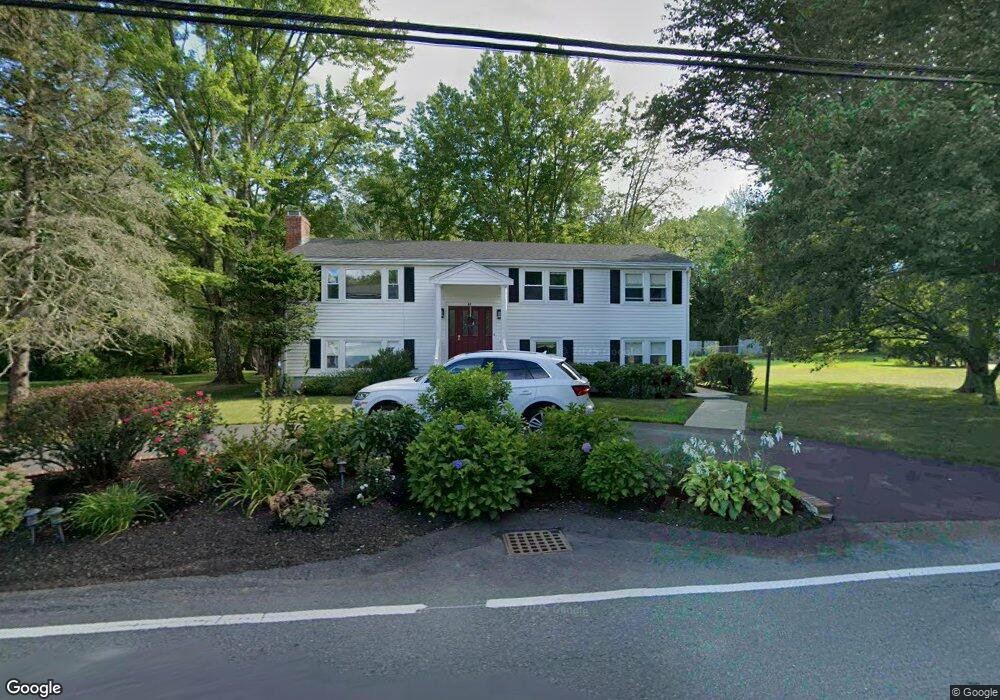
81 Union St Norwood, MA 02062
South Norwood NeighborhoodEstimated Value: $769,797 - $884,000
4
Beds
2
Baths
1,564
Sq Ft
$530/Sq Ft
Est. Value
About This Home
This home is located at 81 Union St, Norwood, MA 02062 and is currently estimated at $829,199, approximately $530 per square foot. 81 Union St is a home located in Norfolk County with nearby schools including Norwood High School and Norwood Montessori School.
Ownership History
Date
Name
Owned For
Owner Type
Purchase Details
Closed on
Apr 8, 2013
Sold by
Gillis Barbara A
Bought by
Gillis Barbara A and Vito Gina
Current Estimated Value
Home Financials for this Owner
Home Financials are based on the most recent Mortgage that was taken out on this home.
Original Mortgage
$220,000
Outstanding Balance
$156,061
Interest Rate
3.58%
Mortgage Type
New Conventional
Estimated Equity
$673,138
Create a Home Valuation Report for This Property
The Home Valuation Report is an in-depth analysis detailing your home's value as well as a comparison with similar homes in the area
Home Values in the Area
Average Home Value in this Area
Purchase History
| Date | Buyer | Sale Price | Title Company |
|---|---|---|---|
| Gillis Barbara A | -- | -- |
Source: Public Records
Mortgage History
| Date | Status | Borrower | Loan Amount |
|---|---|---|---|
| Open | Gillis Barbara A | $220,000 |
Source: Public Records
Tax History Compared to Growth
Tax History
| Year | Tax Paid | Tax Assessment Tax Assessment Total Assessment is a certain percentage of the fair market value that is determined by local assessors to be the total taxable value of land and additions on the property. | Land | Improvement |
|---|---|---|---|---|
| 2025 | $76 | $721,200 | $409,000 | $312,200 |
| 2024 | $7,434 | $710,000 | $409,000 | $301,000 |
| 2023 | $6,448 | $624,800 | $337,800 | $287,000 |
| 2022 | $6,326 | $588,500 | $307,200 | $281,300 |
| 2021 | $6,000 | $529,100 | $296,200 | $232,900 |
| 2020 | $5,792 | $519,500 | $293,600 | $225,900 |
| 2019 | $5,269 | $483,800 | $284,600 | $199,200 |
| 2018 | $5,403 | $487,200 | $285,300 | $201,900 |
| 2017 | $5,195 | $465,900 | $285,300 | $180,600 |
| 2016 | $4,943 | $444,500 | $285,300 | $159,200 |
| 2015 | $5,123 | $446,600 | $259,300 | $187,300 |
| 2014 | $4,891 | $422,400 | $244,800 | $177,600 |
Source: Public Records
Map
Nearby Homes
- 93 Brewster Dr
- 0 Charlotte Rd
- Unit 11 Powder House Ln Unit 11
- 8 Powder House Ln Unit 2
- Unit 12 Powder House Ln Unit 12
- Unit 3 Powder House Ln Unit 3
- 38 Cape Club Dr Unit 38
- 40 Cape Club Dr Unit 40
- 11 Park Ln
- 7 Washington Green
- 188 Richland Rd
- 270 Moosehill Rd
- 256 Norwood St
- 0 Quail Run
- 30 Bullard St
- 363 - 367 Washington St
- 0 Deerfield Rd
- 66 Deerfield Rd
- 23 Ledgeview Dr
- 53-55 Whitewood Cir
- 71 Union St
- 95 Union St
- 80 Union St
- 102 Union St
- 70 Union St Unit 72
- 65 Union St
- 111 Union St
- 36 Independence Way
- 26 Independence Way
- 110 Union St
- 12 Independence Way
- 12 Independence Way Unit 1
- 60 Union St
- 60 Union St Unit 60
- 379 Sumner St
- 44 Independence Way
- 349 Sumner St
- 125 Union St
- 124 Union St
- 337 Sumner St