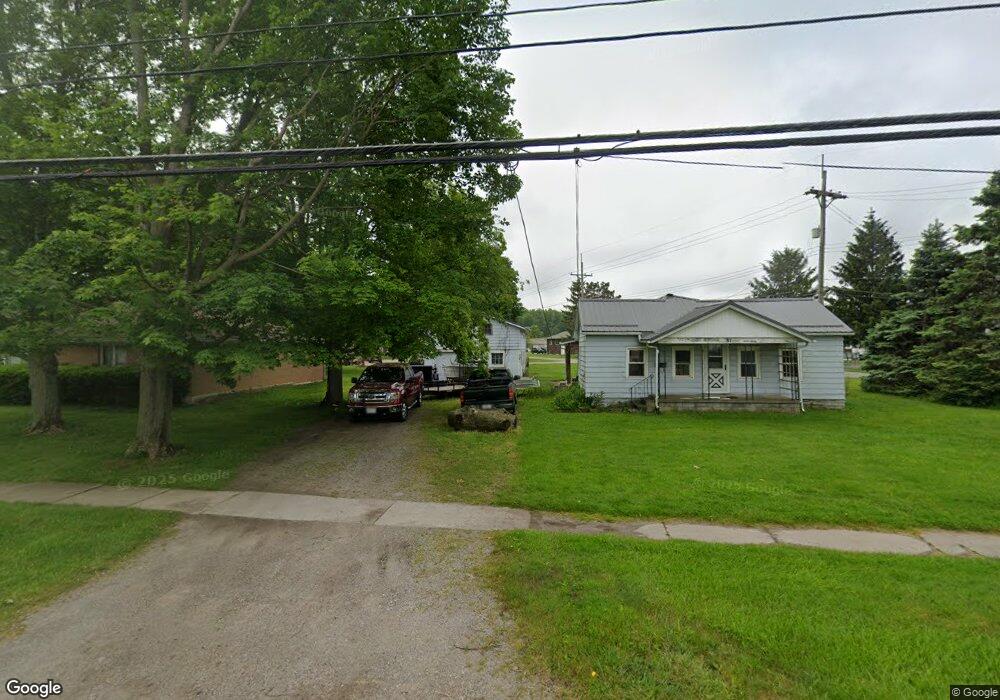
81 W Washington St Norwalk, OH 44857
Estimated Value: $87,000 - $155,000
4
Beds
1
Bath
1,312
Sq Ft
$92/Sq Ft
Est. Value
About This Home
This home is located at 81 W Washington St, Norwalk, OH 44857 and is currently estimated at $120,174, approximately $91 per square foot. 81 W Washington St is a home located in Huron County with nearby schools including Maplehurst Elementary School, League Elementary School, and Pleasant Elementary School.
Ownership History
Date
Name
Owned For
Owner Type
Purchase Details
Closed on
Apr 30, 2003
Bought by
Sitterly Eugene B and Sitterly Mary A
Current Estimated Value
Purchase Details
Closed on
Mar 14, 2003
Bought by
Secretary Of Veterans
Purchase Details
Closed on
Sep 17, 1996
Sold by
Ferree Patrick M
Bought by
Saville Richard F and Saville Carol
Home Financials for this Owner
Home Financials are based on the most recent Mortgage that was taken out on this home.
Original Mortgage
$76,500
Interest Rate
8.29%
Mortgage Type
VA
Purchase Details
Closed on
Jan 25, 1995
Sold by
Eaton James K
Bought by
Ferree Patrick M and Ferree Diane
Home Financials for this Owner
Home Financials are based on the most recent Mortgage that was taken out on this home.
Original Mortgage
$53,600
Interest Rate
5.75%
Mortgage Type
New Conventional
Create a Home Valuation Report for This Property
The Home Valuation Report is an in-depth analysis detailing your home's value as well as a comparison with similar homes in the area
Home Values in the Area
Average Home Value in this Area
Purchase History
| Date | Buyer | Sale Price | Title Company |
|---|---|---|---|
| Sitterly Eugene B | -- | -- | |
| Secretary Of Veterans | $62,600 | -- | |
| Saville Richard F | $75,000 | -- | |
| Ferree Patrick M | $67,000 | -- | |
| Ferree Patrick M | $67,000 | -- |
Source: Public Records
Mortgage History
| Date | Status | Borrower | Loan Amount |
|---|---|---|---|
| Previous Owner | Saville Richard F | $76,500 | |
| Previous Owner | Ferree Patrick M | $53,600 |
Source: Public Records
Tax History Compared to Growth
Tax History
| Year | Tax Paid | Tax Assessment Tax Assessment Total Assessment is a certain percentage of the fair market value that is determined by local assessors to be the total taxable value of land and additions on the property. | Land | Improvement |
|---|---|---|---|---|
| 2024 | $801 | $19,270 | $10,520 | $8,750 |
| 2023 | $801 | $21,350 | $8,890 | $12,460 |
| 2022 | $879 | $21,350 | $8,890 | $12,460 |
| 2021 | $879 | $21,350 | $8,890 | $12,460 |
| 2020 | $804 | $18,570 | $8,890 | $9,680 |
| 2019 | $787 | $18,570 | $8,890 | $9,680 |
| 2018 | $773 | $18,570 | $8,890 | $9,680 |
| 2017 | $716 | $17,120 | $8,890 | $8,230 |
| 2016 | $703 | $17,120 | $8,890 | $8,230 |
| 2015 | $703 | $17,120 | $8,890 | $8,230 |
| 2014 | $756 | $18,240 | $8,890 | $9,350 |
| 2013 | $659 | $18,240 | $8,890 | $9,350 |
Source: Public Records
Map
Nearby Homes
- 102 N Pleasant St
- 167 Whittlesey Ave
- 13 Spring St
- 15 E Washington St
- 4 Deer Track Trail Unit A
- 230 Whittlesey Ave Unit 59
- 230 Whittlesey Ave Unit 72
- 12 Minard Place
- 11 Deer Track Trail Unit A
- 6 N West St
- 33 Falcon Crest Dr Unit C
- 157 W Main St
- 42 Grassland Cir
- 29 W Seminary St
- 57 Milan Ave
- 144 Sycamore Dr
- 253 W Main St
- 123 E Main St
- 21 Maple St
- 27 Norwood Ave
- 77 W Washington St
- 84 W Washington St
- 86 W Washington St
- 82 W Washington St
- 80 W Washington St
- 90 W Washington St
- 138 N Pleasant St
- 92 W Washington St
- 78 W Washington St
- 133 Newton St
- 131 N Pleasant St
- 93 W Washington St
- 76 W Washington St
- 131 Newton St
- 133 N Pleasant St
- 125 N Pleasant St
- 94 W Washington St
- 129 Newton St
- 70 W Washington St
- 127 Newton St