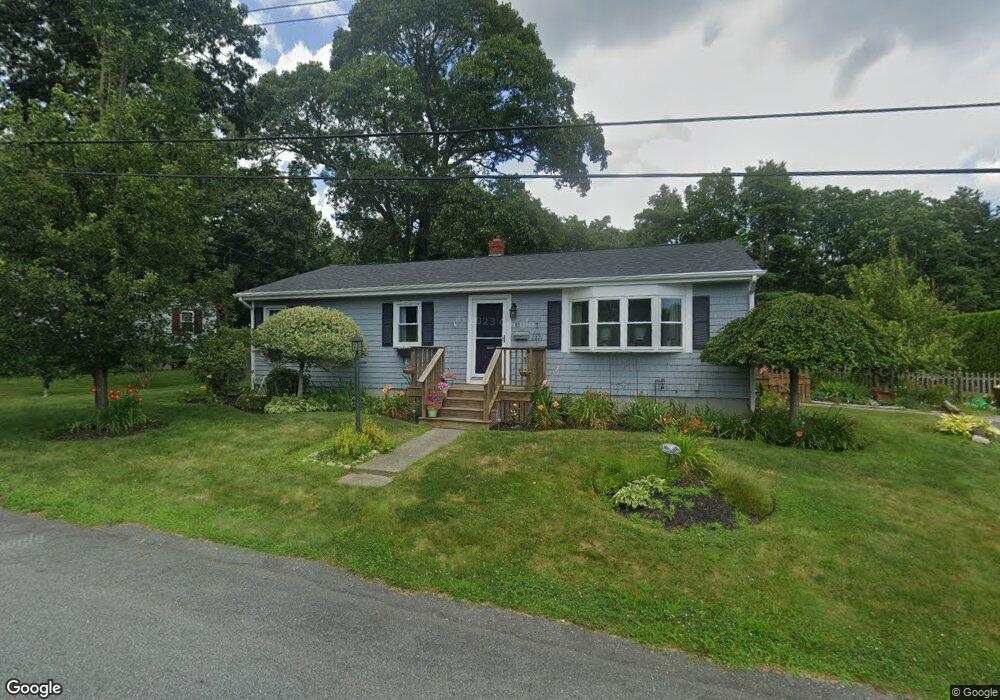
81 Wamsutta Ave Acushnet, MA 02743
Upper Acushnet NeighborhoodEstimated Value: $458,905 - $513,000
3
Beds
1
Bath
1,650
Sq Ft
$299/Sq Ft
Est. Value
About This Home
This home is located at 81 Wamsutta Ave, Acushnet, MA 02743 and is currently estimated at $493,476, approximately $299 per square foot. 81 Wamsutta Ave is a home located in Bristol County with nearby schools including Acushnet Elementary School, Albert F Ford Middle School, and Alma Del Mar Charter School.
Ownership History
Date
Name
Owned For
Owner Type
Purchase Details
Closed on
May 28, 2010
Sold by
Gaudette Louis and Gaudette Ronald
Bought by
Leblanc Brandon M and Escobar Rachel L
Current Estimated Value
Home Financials for this Owner
Home Financials are based on the most recent Mortgage that was taken out on this home.
Original Mortgage
$214,200
Outstanding Balance
$144,680
Interest Rate
5.13%
Mortgage Type
Purchase Money Mortgage
Estimated Equity
$348,796
Purchase Details
Closed on
Apr 14, 2004
Sold by
Gaudette Lena M and Gaudette Rodolphe G
Bought by
Mccusker Ann and Lachance Elaine
Create a Home Valuation Report for This Property
The Home Valuation Report is an in-depth analysis detailing your home's value as well as a comparison with similar homes in the area
Home Values in the Area
Average Home Value in this Area
Purchase History
| Date | Buyer | Sale Price | Title Company |
|---|---|---|---|
| Leblanc Brandon M | $238,000 | -- | |
| Mccusker Ann | -- | -- |
Source: Public Records
Mortgage History
| Date | Status | Borrower | Loan Amount |
|---|---|---|---|
| Open | Mccusker Ann | $214,200 |
Source: Public Records
Tax History Compared to Growth
Tax History
| Year | Tax Paid | Tax Assessment Tax Assessment Total Assessment is a certain percentage of the fair market value that is determined by local assessors to be the total taxable value of land and additions on the property. | Land | Improvement |
|---|---|---|---|---|
| 2025 | $42 | $388,600 | $119,100 | $269,500 |
| 2024 | $3,986 | $349,300 | $112,900 | $236,400 |
| 2023 | $3,860 | $321,700 | $102,400 | $219,300 |
| 2022 | $3,814 | $287,400 | $96,100 | $191,300 |
| 2021 | $3,584 | $264,900 | $96,100 | $168,800 |
| 2020 | $3,606 | $258,700 | $89,900 | $168,800 |
| 2019 | $3,084 | $239,000 | $85,700 | $153,300 |
| 2018 | $4,539 | $225,800 | $85,700 | $140,100 |
| 2017 | $2,925 | $217,800 | $85,700 | $132,100 |
| 2016 | $3,044 | $209,500 | $85,700 | $123,800 |
| 2015 | $2,875 | $201,300 | $85,700 | $115,600 |
Source: Public Records
Map
Nearby Homes