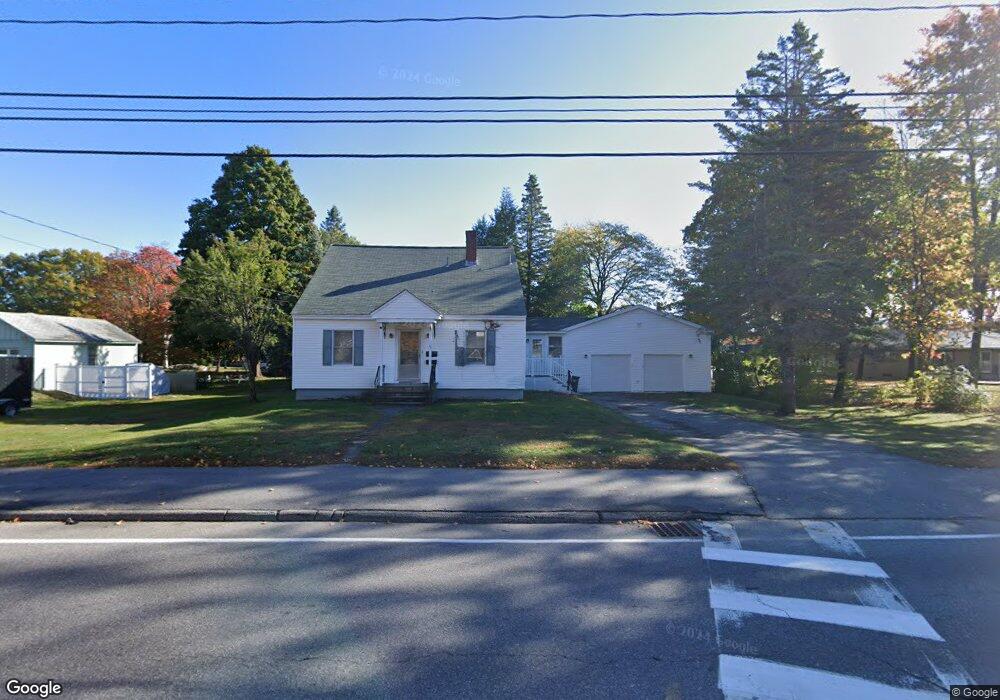
81 West St Biddeford, ME 04005
Estimated Value: $419,000 - $552,000
3
Beds
2
Baths
1,980
Sq Ft
$244/Sq Ft
Est. Value
About This Home
This home is located at 81 West St, Biddeford, ME 04005 and is currently estimated at $483,980, approximately $244 per square foot. 81 West St is a home located in York County with nearby schools including John F Kennedy Memorial School, Biddeford Primary School, and Biddeford Intermediate School.
Ownership History
Date
Name
Owned For
Owner Type
Purchase Details
Closed on
Dec 14, 2021
Sold by
Beauchesne Joan M
Bought by
Beauchesne Joan M and Beauchesne Michael J
Current Estimated Value
Home Financials for this Owner
Home Financials are based on the most recent Mortgage that was taken out on this home.
Original Mortgage
$200,000
Interest Rate
3.45%
Mortgage Type
Purchase Money Mortgage
Create a Home Valuation Report for This Property
The Home Valuation Report is an in-depth analysis detailing your home's value as well as a comparison with similar homes in the area
Home Values in the Area
Average Home Value in this Area
Purchase History
| Date | Buyer | Sale Price | Title Company |
|---|---|---|---|
| Beauchesne Joan M | -- | None Available |
Source: Public Records
Mortgage History
| Date | Status | Borrower | Loan Amount |
|---|---|---|---|
| Previous Owner | Beauchesne Joan M | $200,000 |
Source: Public Records
Tax History
| Year | Tax Paid | Tax Assessment Tax Assessment Total Assessment is a certain percentage of the fair market value that is determined by local assessors to be the total taxable value of land and additions on the property. | Land | Improvement |
|---|---|---|---|---|
| 2025 | $5,919 | $396,200 | $161,500 | $234,700 |
| 2024 | $5,569 | $391,600 | $161,500 | $230,100 |
| 2023 | $5,101 | $388,800 | $158,700 | $230,100 |
| 2022 | $4,506 | $274,600 | $89,200 | $185,400 |
| 2021 | $3,743 | $230,300 | $75,400 | $154,900 |
| 2020 | $0 | $210,100 | $68,700 | $141,400 |
| 2019 | $4,198 | $210,100 | $68,700 | $141,400 |
| 2018 | $3,582 | $210,100 | $68,700 | $141,400 |
| 2017 | $2,034 | $205,000 | $68,700 | $136,300 |
| 2016 | $4,897 | $205,000 | $68,700 | $136,300 |
| 2015 | $3,797 | $205,000 | $68,700 | $136,300 |
| 2014 | $3,703 | $205,000 | $68,700 | $136,300 |
| 2013 | -- | $205,000 | $62,000 | $143,000 |
Source: Public Records
Map
Nearby Homes
Your Personal Tour Guide
Ask me questions while you tour the home.