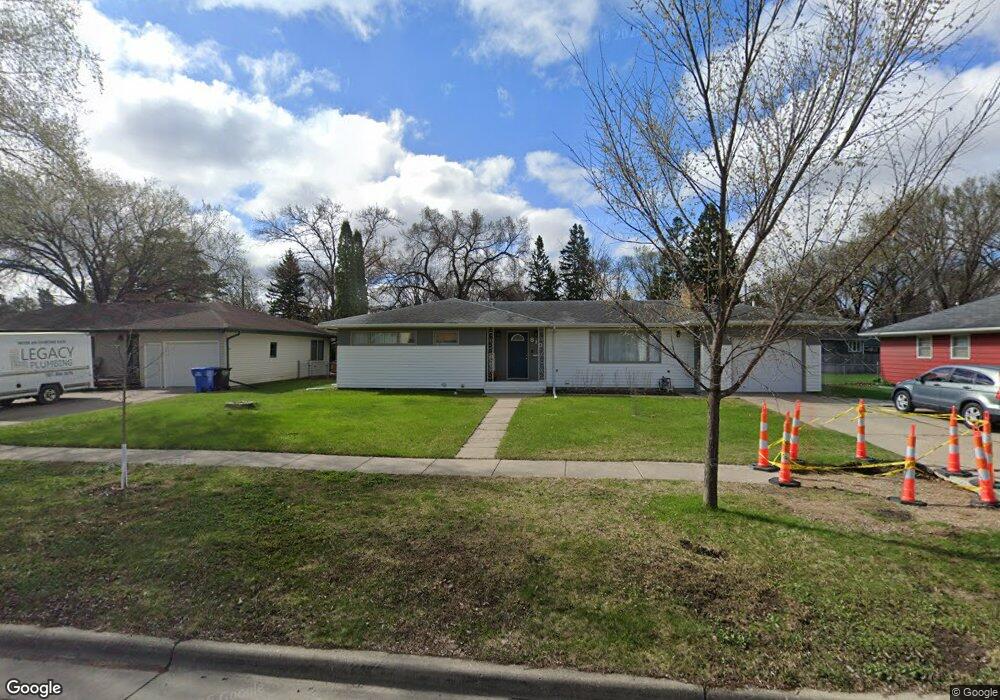
810 18th Ave S Fargo, ND 58103
Clara Barton NeighborhoodEstimated Value: $291,000 - $308,000
3
Beds
2
Baths
2,656
Sq Ft
$113/Sq Ft
Est. Value
About This Home
This home is located at 810 18th Ave S, Fargo, ND 58103 and is currently estimated at $299,883, approximately $112 per square foot. 810 18th Ave S is a home located in Cass County with nearby schools including Clara Barton Elementary School, Carl Ben Eielson Middle School, and South High School.
Ownership History
Date
Name
Owned For
Owner Type
Purchase Details
Closed on
Sep 24, 2019
Sold by
Catalyst Investments Llc
Bought by
Michels Craig and Ostroot Katherine
Current Estimated Value
Home Financials for this Owner
Home Financials are based on the most recent Mortgage that was taken out on this home.
Original Mortgage
$217,950
Outstanding Balance
$190,907
Interest Rate
3.6%
Mortgage Type
New Conventional
Estimated Equity
$108,976
Purchase Details
Closed on
Oct 10, 2018
Sold by
Christians Eric D and Christians Jennie A
Bought by
Catalyst Investments Llc
Purchase Details
Closed on
Aug 15, 2018
Sold by
Simenson Ernest V and Lighthouse Associates Inc
Bought by
Christians Eric D
Create a Home Valuation Report for This Property
The Home Valuation Report is an in-depth analysis detailing your home's value as well as a comparison with similar homes in the area
Home Values in the Area
Average Home Value in this Area
Purchase History
| Date | Buyer | Sale Price | Title Company |
|---|---|---|---|
| Michels Craig | $229,000 | Regency Title Inc | |
| Catalyst Investments Llc | -- | Fm Title | |
| Christians Eric D | $143,000 | Fm Title |
Source: Public Records
Mortgage History
| Date | Status | Borrower | Loan Amount |
|---|---|---|---|
| Open | Michels Craig | $217,950 |
Source: Public Records
Tax History Compared to Growth
Tax History
| Year | Tax Paid | Tax Assessment Tax Assessment Total Assessment is a certain percentage of the fair market value that is determined by local assessors to be the total taxable value of land and additions on the property. | Land | Improvement |
|---|---|---|---|---|
| 2024 | $5,121 | $149,750 | $39,000 | $110,750 |
| 2023 | $5,380 | $139,950 | $39,000 | $100,950 |
| 2022 | $5,107 | $126,100 | $39,000 | $87,100 |
| 2021 | $4,765 | $114,050 | $41,250 | $72,800 |
| 2020 | $4,795 | $114,050 | $41,250 | $72,800 |
| 2019 | $4,105 | $87,200 | $25,800 | $61,400 |
| 2018 | $4,117 | $87,200 | $25,800 | $61,400 |
| 2017 | $1,028 | $87,200 | $25,800 | $61,400 |
| 2016 | $1,433 | $106,600 | $25,800 | $80,800 |
| 2015 | $2,497 | $83,700 | $17,550 | $66,150 |
| 2014 | $2,391 | $77,500 | $17,550 | $59,950 |
| 2013 | $2,393 | $77,500 | $17,550 | $59,950 |
Source: Public Records
Map
Nearby Homes
- 1710 14th St S
- 1550 13 1 2 St S
- 1439 10th St S
- 1361 16th Ave S
- 1834 14 1 2 St S
- 2309 9th St S
- 1425 11th St S
- 1718 15th St S
- 1550 14 1 2 St S
- 1545 15th St S
- 1301 10th St S
- 1405 25th Ave S Unit A201
- 2440 15th St S Unit B14
- 1917 16 1 2 St S
- 1314 14th St S
- 1838 17th St S
- 1208 University Dr S
- 2517 W Country Club Dr S Unit 10
- 1124 University Dr S
- 1112 University Dr S