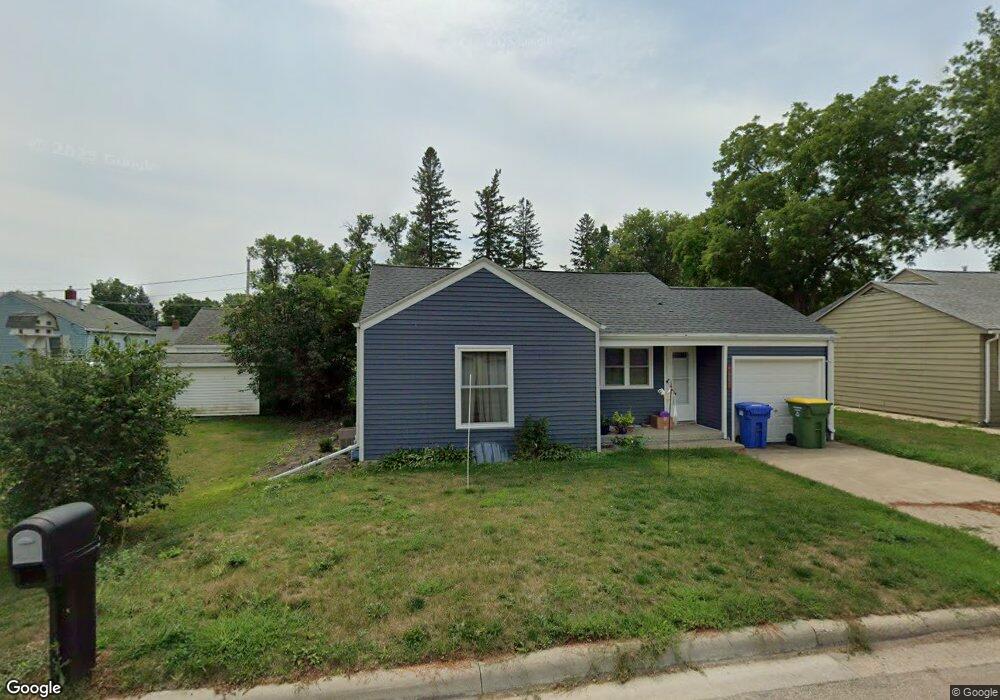
810 6th St SW Pipestone, MN 56164
Estimated Value: $119,000 - $157,000
About This Home
This home is located at 810 6th St SW, Pipestone, MN 56164 and is currently estimated at $130,691, approximately $139 per square foot. 810 6th St SW is a home located in Pipestone County with nearby schools including Brown Elementary School, Pipestone Elementary School, and Pipestone Head Start.
Ownership History
We collect this data history from publicly available records. To have your information removed, we recommend requesting removal directly through your county’s website.
Purchase Details
Purchase Details
Purchase Details
Home Financials for this Owner
Home Financials are based on the most recent Mortgage that was taken out on this home.Purchase Details
Home Financials for this Owner
Home Financials are based on the most recent Mortgage that was taken out on this home.Home Values in the Area
Average Home Value in this Area
Purchase History
We collect this data history from publicly available records. To have your information removed, we recommend requesting removal directly through your county’s website.
| Date | Buyer | Sale Price | Title Company |
|---|---|---|---|
| $75,000 | None Listed On Document | ||
| $75,000 | None Listed On Document | ||
| -- | -- | ||
| -- | -- |
Mortgage History
We collect this data history from publicly available records. To have your information removed, we recommend requesting removal directly through your county’s website.
| Date | Status | Borrower | Loan Amount |
|---|---|---|---|
| Previous Owner | $36,900 | ||
| Previous Owner | $34,000 |
Tax History
We collect this data history from publicly available records. To have your information removed, we recommend requesting removal directly through your county’s website.
| Year | Tax Paid | Tax Assessment Tax Assessment Total Assessment is a certain percentage of the fair market value that is determined by local assessors to be the total taxable value of land and additions on the property. | Land | Improvement |
|---|---|---|---|---|
| 2025 | $924 | $97,600 | $6,700 | $90,900 |
| 2024 | $924 | $97,600 | $6,700 | $90,900 |
| 2023 | $570 | $68,100 | $6,700 | $61,400 |
| 2022 | $532 | $52,800 | $4,800 | $48,000 |
| 2021 | $542 | $46,600 | $4,800 | $41,800 |
| 2020 | $538 | $46,600 | $4,800 | $41,800 |
| 2019 | $520 | $45,900 | $4,000 | $41,900 |
| 2018 | $472 | $44,300 | $4,000 | $40,300 |
| 2017 | $482 | $40,800 | $4,000 | $36,800 |
| 2016 | $442 | $0 | $0 | $0 |
| 2015 | $496 | $24,200 | $2,402 | $21,798 |
| 2014 | $496 | $24,400 | $2,404 | $21,996 |
Map
- 825 7th St SW
- 604 7th Ave SW
- 913 9th Ave SW
- 1102 9th Ave SW
- 901 9th Ave SW
- 907 9th Ave SW
- 807 8th St SW
- 406 8th Ave SW
- 901 7th Ave SW
- 515 5th Ave SW
- 106 8th Ave SW
- 831 4th Ave SW
- 1120 8th Ave SW
- 412 Main St W
- 910 3rd Ave SW
- 219 3rd Ave SW
- 1106 6th Ave SW
- 919 3rd Ave SW
- 1108 5th Ave SW
- 1105 5th Ave SW
Ask me questions while you tour the home.