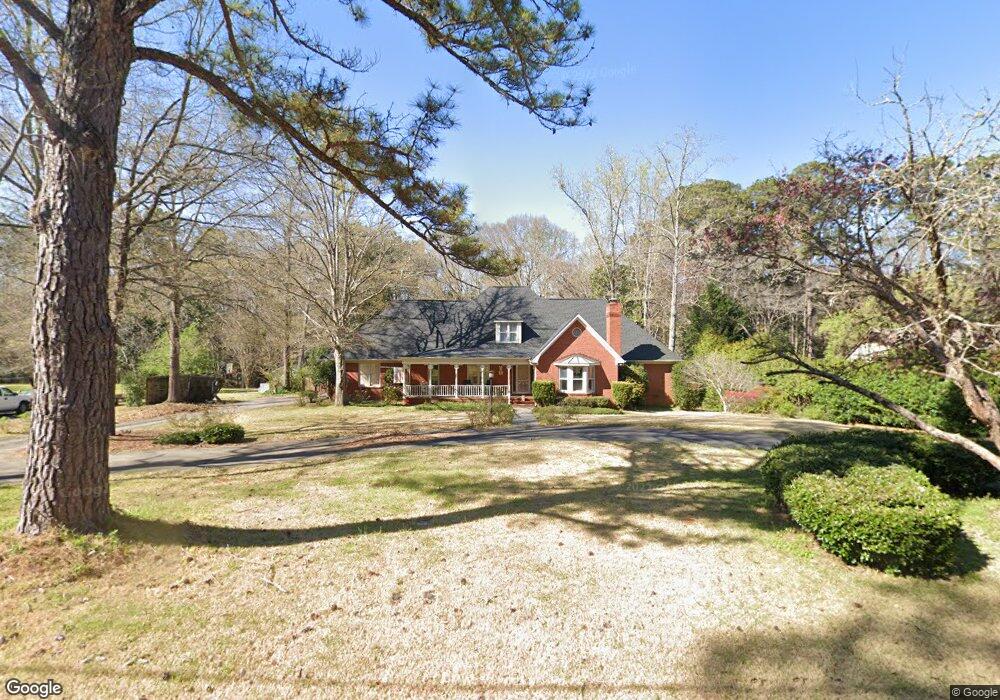
810 Camellia Dr Lagrange, GA 30240
Estimated Value: $455,139 - $580,000
5
Beds
4
Baths
6,614
Sq Ft
$81/Sq Ft
Est. Value
About This Home
This home is located at 810 Camellia Dr, Lagrange, GA 30240 and is currently estimated at $533,035, approximately $80 per square foot. 810 Camellia Dr is a home located in Troup County with nearby schools including Hollis Hand Elementary School, Franklin Forest Elementary School, and Ethel W. Kight Elementary School.
Ownership History
Date
Name
Owned For
Owner Type
Purchase Details
Closed on
Oct 17, 2013
Sold by
Kostilink Theodore J
Bought by
Poe Michael Gene
Current Estimated Value
Home Financials for this Owner
Home Financials are based on the most recent Mortgage that was taken out on this home.
Original Mortgage
$261,182
Outstanding Balance
$192,540
Interest Rate
4.25%
Mortgage Type
FHA
Estimated Equity
$340,495
Purchase Details
Closed on
Sep 11, 2000
Sold by
Ohara James Kevin and Ohara Teresa A
Bought by
Kostilnik Theodore and Kostilnik Catherine
Purchase Details
Closed on
Dec 2, 1999
Sold by
Jonathan Dailey W and Jonathan Kathryn S
Bought by
Ohara James Kevin and Ohara Teresa A
Purchase Details
Closed on
Nov 15, 1995
Sold by
Jan Marie M Ma'Luf
Bought by
Jonathan Dailey W and Jonathan Kathryn S
Purchase Details
Closed on
May 18, 1979
Bought by
Jan Marie M Ma'Luf
Purchase Details
Closed on
Jan 1, 1971
Create a Home Valuation Report for This Property
The Home Valuation Report is an in-depth analysis detailing your home's value as well as a comparison with similar homes in the area
Purchase History
| Date | Buyer | Sale Price | Title Company |
|---|---|---|---|
| Poe Michael Gene | $266,000 | -- | |
| Kostilnik Theodore | $235,500 | -- | |
| Ohara James Kevin | $222,500 | -- | |
| Jonathan Dailey W | $207,000 | -- | |
| Jan Marie M Ma'Luf | $28,500 | -- | |
| -- | -- | -- |
Source: Public Records
Mortgage History
| Date | Status | Borrower | Loan Amount |
|---|---|---|---|
| Open | Poe Michael Gene | $261,182 |
Source: Public Records
Tax History
| Year | Tax Paid | Tax Assessment Tax Assessment Total Assessment is a certain percentage of the fair market value that is determined by local assessors to be the total taxable value of land and additions on the property. | Land | Improvement |
|---|---|---|---|---|
| 2025 | $4,740 | $185,300 | $18,000 | $167,300 |
| 2024 | $4,271 | $158,592 | $16,000 | $142,592 |
| 2023 | $4,093 | $152,060 | $16,000 | $136,060 |
| 2022 | $3,981 | $144,620 | $16,000 | $128,620 |
| 2021 | $3,472 | $117,120 | $16,000 | $101,120 |
| 2020 | $3,472 | $117,120 | $16,000 | $101,120 |
| 2019 | $3,472 | $117,120 | $16,000 | $101,120 |
| 2018 | $3,328 | $112,320 | $16,000 | $96,320 |
| 2017 | $3,150 | $106,440 | $16,000 | $90,440 |
| 2016 | $3,108 | $105,022 | $16,000 | $89,022 |
| 2015 | $3,173 | $105,022 | $16,000 | $89,022 |
| 2014 | $3,030 | $100,138 | $16,000 | $84,138 |
| 2013 | -- | $97,781 | $16,000 | $81,781 |
Source: Public Records
Map
Nearby Homes
- 203 S Chilton Crescent
- 201 S Chilton Crescent
- 732 Camellia Dr
- 724 Camellia Dr
- 106 Ewing St
- 102 Beech Creek Dr
- 204 Dixie Creek Dr
- 910 Piney Woods Dr
- 222 Beechwood Cir
- 204 Colonial St
- 110 Russell St
- 104 Sweetgum Dr
- 900 North St
- 806 New Franklin Rd
- 109 Thomas St
- 705 Piney Woods Dr
- 1784 Mooty Bridge Rd
- 114 Briarcliff Rd
- 219 Banks St
- 120 Saynor Cir
- 810 Camellia Dr Unit 182
- 812 Camellia Dr
- 808 Camellia Dr
- 809 Camellia Dr
- 806 Camellia Dr
- 814 Camellia Dr
- 811 Camellia Dr
- 807 Camellia Dr
- 209 Chesterfield Place
- 804 Camellia Dr
- 816 Wisteria Way
- 808 Wisteria Way
- 212 Chesterfield Place
- 207 Chesterfield Place
- 205 Chesterfield Place
- 806 Wisteria Way
- 911 Lakewood Dr
- 802 Camellia Dr
- 200 Warwick Rd
- 210 Chesterfield Place
Your Personal Tour Guide
Ask me questions while you tour the home.