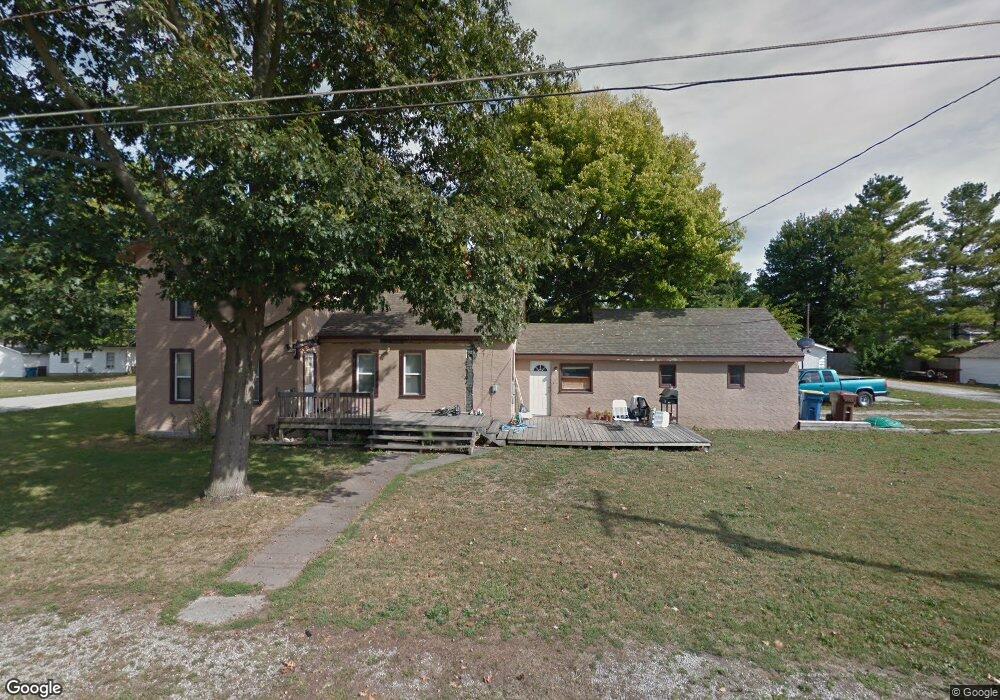
810 Colgrove St Waterloo, IN 46793
Estimated Value: $92,000 - $146,000
3
Beds
1
Bath
1,788
Sq Ft
$65/Sq Ft
Est. Value
About This Home
This home is located at 810 Colgrove St, Waterloo, IN 46793 and is currently estimated at $117,004, approximately $65 per square foot. 810 Colgrove St is a home located in DeKalb County with nearby schools including DeKalb High School.
Ownership History
Date
Name
Owned For
Owner Type
Purchase Details
Closed on
Sep 27, 2024
Sold by
Adcox Nycole D
Bought by
Farrell Joseph
Current Estimated Value
Home Financials for this Owner
Home Financials are based on the most recent Mortgage that was taken out on this home.
Original Mortgage
$76,000
Outstanding Balance
$75,218
Interest Rate
6.46%
Mortgage Type
New Conventional
Estimated Equity
$41,786
Purchase Details
Closed on
Jan 29, 2010
Sold by
Koeppe Randall and Yockum David L
Bought by
Adcox Nycole D
Home Financials for this Owner
Home Financials are based on the most recent Mortgage that was taken out on this home.
Original Mortgage
$68,877
Interest Rate
5.2%
Mortgage Type
New Conventional
Purchase Details
Closed on
Jun 5, 2008
Sold by
Homesales Inc
Bought by
Koeppe Randall and Yockum David L
Purchase Details
Closed on
Mar 10, 2008
Sold by
Jpmorgan Chase Bank N A
Bought by
Homesales Inc
Purchase Details
Closed on
Mar 6, 2008
Sold by
Swartz Michele J and Swartz Michele
Bought by
Jpmorgan Chase Bank N A
Create a Home Valuation Report for This Property
The Home Valuation Report is an in-depth analysis detailing your home's value as well as a comparison with similar homes in the area
Home Values in the Area
Average Home Value in this Area
Purchase History
| Date | Buyer | Sale Price | Title Company |
|---|---|---|---|
| Farrell Joseph | $95,000 | None Listed On Document | |
| Adcox Nycole D | -- | None Available | |
| Koeppe Randall | $14,500 | Heritage Title Llc | |
| Homesales Inc | -- | None Available | |
| Jpmorgan Chase Bank N A | $51,388 | None Available |
Source: Public Records
Mortgage History
| Date | Status | Borrower | Loan Amount |
|---|---|---|---|
| Open | Farrell Joseph | $76,000 | |
| Previous Owner | Adcox Nycole D | $68,877 |
Source: Public Records
Tax History Compared to Growth
Tax History
| Year | Tax Paid | Tax Assessment Tax Assessment Total Assessment is a certain percentage of the fair market value that is determined by local assessors to be the total taxable value of land and additions on the property. | Land | Improvement |
|---|---|---|---|---|
| 2024 | $539 | $85,700 | $21,700 | $64,000 |
| 2023 | $436 | $80,100 | $20,200 | $59,900 |
| 2022 | $450 | $77,800 | $19,000 | $58,800 |
| 2021 | $410 | $74,200 | $19,000 | $55,200 |
| 2020 | $378 | $71,900 | $19,000 | $52,900 |
| 2019 | $343 | $62,200 | $19,000 | $43,200 |
| 2018 | $346 | $62,200 | $19,000 | $43,200 |
| 2017 | $353 | $63,700 | $19,000 | $44,700 |
| 2016 | $388 | $69,500 | $19,900 | $49,600 |
| 2014 | $210 | $40,700 | $13,400 | $27,300 |
Source: Public Records
Map
Nearby Homes
- 820 N Wayne St
- 420 E Marion St
- 235 W Railroad St
- 265 S Center St
- 420 W Maple St
- 585 Meadow Ln
- 580 Meadow Ln
- Lot 4 & 8 Wayne St
- 3488 County Road 39
- 3436 Fawn Creek Blvd
- 3333 Sika Trail
- 3353 Sika Trail
- 3361 Sika Trail
- 3356 Sika Trail
- 3322 Sika Trail
- 3459 Chital Cove
- 3451 Fawn Creek Blvd
- Bellamy Plan at Fawn Creek Estates
- Chatham Plan at Fawn Creek Estates
- Henley Plan at Fawn Creek Estates
- 820 Colgrove St
- 810 N Colgrove St
- 830 Colgrove St
- 805 Colgrove St
- 835 Colgrove St
- 770 Colgrove St
- 845 Colgrove St
- 825 N Wayne St
- 100 Middle St
- 850 Colgrove St
- 775 N Wayne St
- 875 Colgrove St
- 755 Colgrove St
- 740 Colgrove St
- 755 N Wayne St
- 865 N Wayne St
- 745 N Wayne St
- 900 N Ruman St
- 875 N Wayne St
- 830 N Wayne St