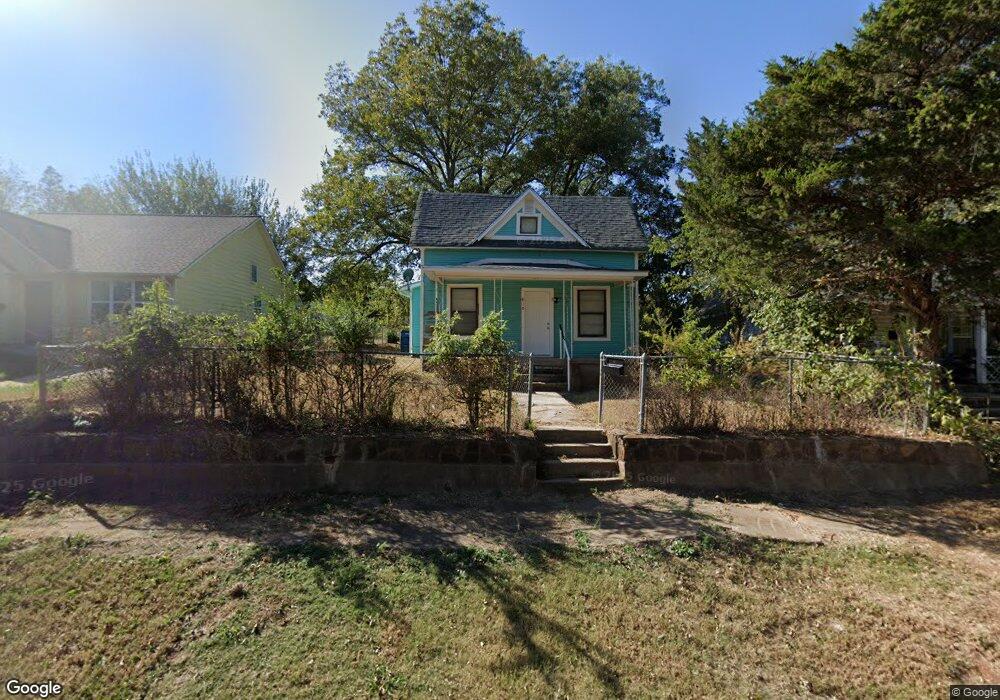
810 Hobson St Shawnee, OK 74801
Estimated Value: $42,000 - $77,000
3
Beds
1
Bath
1,136
Sq Ft
$53/Sq Ft
Est. Value
About This Home
This home is located at 810 Hobson St, Shawnee, OK 74801 and is currently estimated at $60,095, approximately $52 per square foot. 810 Hobson St is a home located in Pottawatomie County with nearby schools including Sequoyah Elementary School, Shawnee Middle School, and Shawnee High School.
Ownership History
Date
Name
Owned For
Owner Type
Purchase Details
Closed on
Apr 2, 2025
Sold by
Merge Lane Properties Llc
Bought by
Merge Lane Properties Llc
Current Estimated Value
Purchase Details
Closed on
Aug 7, 2024
Sold by
Sapps Rentals Llc
Bought by
Merge Lane Properties Llc
Purchase Details
Closed on
Oct 8, 2020
Sold by
Lowrey Dee and Lowrey William
Bought by
Sapp Kenneth and Sapp Jaquelyn
Purchase Details
Closed on
Apr 6, 2015
Sold by
Pointer Velma Jean
Bought by
Jackson Judith J and Jackson Phillip W
Purchase Details
Closed on
Jul 14, 1993
Sold by
Pointer Velma
Bought by
Pointer Velma and Pointer Dee
Create a Home Valuation Report for This Property
The Home Valuation Report is an in-depth analysis detailing your home's value as well as a comparison with similar homes in the area
Purchase History
| Date | Buyer | Sale Price | Title Company |
|---|---|---|---|
| Merge Lane Properties Llc | -- | None Listed On Document | |
| Merge Lane Properties Llc | $524,000 | None Listed On Document | |
| Sapp Kenneth | $16,500 | First American Title Ins Co | |
| Jackson Judith J | -- | None Available | |
| Lowray Lee Ann | -- | None Available | |
| Pointer Velma | -- | -- |
Source: Public Records
Tax History
| Year | Tax Paid | Tax Assessment Tax Assessment Total Assessment is a certain percentage of the fair market value that is determined by local assessors to be the total taxable value of land and additions on the property. | Land | Improvement |
|---|---|---|---|---|
| 2025 | $209 | $3,479 | $486 | $2,993 |
| 2024 | $202 | $2,030 | $486 | $1,544 |
| 2023 | $202 | $1,933 | $486 | $1,447 |
| 2022 | $198 | $1,933 | $486 | $1,447 |
| 2021 | $200 | $1,980 | $480 | $1,500 |
| 2020 | $142 | $2,409 | $352 | $2,057 |
| 2019 | $140 | $2,340 | $342 | $1,998 |
| 2018 | $130 | $2,271 | $332 | $1,939 |
| 2017 | $122 | $2,205 | $318 | $1,887 |
| 2016 | $116 | $2,141 | $306 | $1,835 |
| 2015 | $108 | $2,078 | $291 | $1,787 |
| 2014 | $102 | $2,018 | $272 | $1,746 |
Source: Public Records
Map
Nearby Homes
- 824 N Union Ave
- 902 N Beard Ave
- 110 E Dewey St
- 204 W Wallace St
- 641 N Broadway Ave
- 819 N Park Ave
- 434 E Wallace St
- 1006 N Market Ave
- 636 N Market Ave
- 128 W Ridgewood St
- 1102 N Park Ave
- 623 N Park Ave
- 307 N Louisa Ave
- 506 N Louisa Ave
- 536 N Beard Ave
- 731 N Kickapoo Ave
- 1108 N Pennsylvania Ave
- 508 N Market Ave Unit A & B
- 222 W Highland St
- 519 W Ford St
Your Personal Tour Guide
Ask me questions while you tour the home.