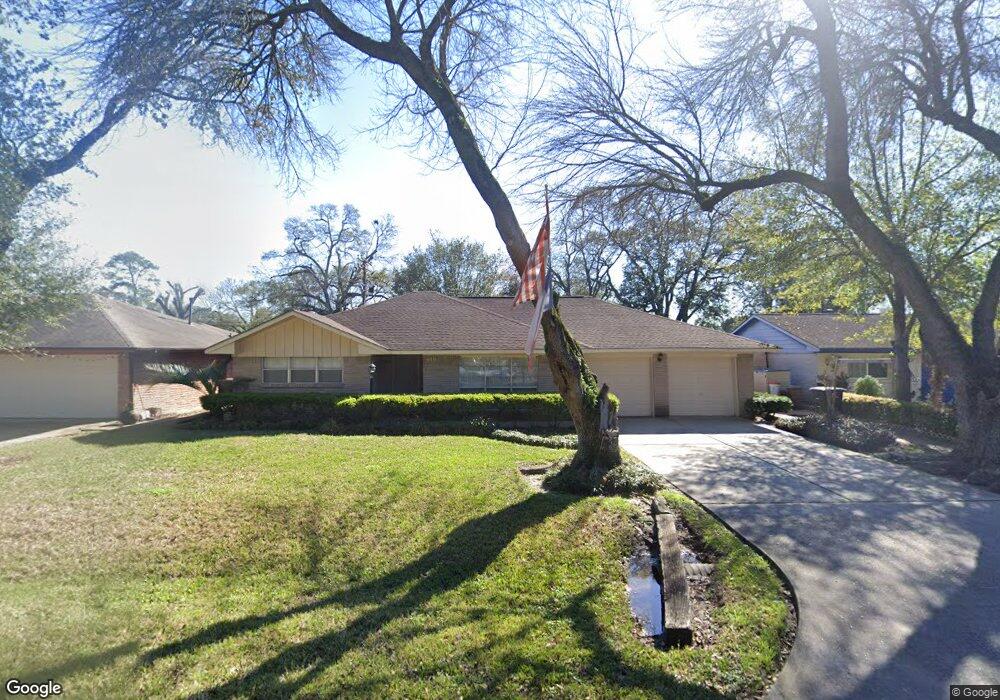
810 Hurley St Houston, TX 77022
Northside-Northline NeighborhoodEstimated Value: $259,249 - $315,000
2
Beds
2
Baths
1,704
Sq Ft
$167/Sq Ft
Est. Value
About This Home
This home is located at 810 Hurley St, Houston, TX 77022 and is currently estimated at $284,062, approximately $166 per square foot. 810 Hurley St is a home located in Harris County with nearby schools including Burbank Elementary School, Burbank Middle School, and Sam Houston Math, Science & Technology Center.
Ownership History
Date
Name
Owned For
Owner Type
Purchase Details
Closed on
Apr 26, 2000
Sold by
Cooley Charles Edward
Bought by
Villarreal Guillermo
Current Estimated Value
Home Financials for this Owner
Home Financials are based on the most recent Mortgage that was taken out on this home.
Original Mortgage
$58,200
Outstanding Balance
$20,208
Interest Rate
8.21%
Estimated Equity
$263,854
Create a Home Valuation Report for This Property
The Home Valuation Report is an in-depth analysis detailing your home's value as well as a comparison with similar homes in the area
Home Values in the Area
Average Home Value in this Area
Purchase History
| Date | Buyer | Sale Price | Title Company |
|---|---|---|---|
| Villarreal Guillermo | -- | Texas American Title Company |
Source: Public Records
Mortgage History
| Date | Status | Borrower | Loan Amount |
|---|---|---|---|
| Open | Villarreal Guillermo | $58,200 |
Source: Public Records
Tax History Compared to Growth
Tax History
| Year | Tax Paid | Tax Assessment Tax Assessment Total Assessment is a certain percentage of the fair market value that is determined by local assessors to be the total taxable value of land and additions on the property. | Land | Improvement |
|---|---|---|---|---|
| 2025 | $2,959 | $243,043 | $94,635 | $148,408 |
| 2024 | $2,959 | $232,527 | $86,853 | $145,674 |
| 2023 | $2,959 | $287,463 | $52,921 | $234,542 |
| 2022 | $4,153 | $234,880 | $52,921 | $181,959 |
| 2021 | $3,997 | $187,357 | $52,921 | $134,436 |
| 2020 | $3,775 | $169,356 | $52,921 | $116,435 |
| 2019 | $3,586 | $169,709 | $43,582 | $126,127 |
| 2018 | $2,319 | $136,097 | $36,422 | $99,675 |
| 2017 | $2,962 | $136,097 | $36,422 | $99,675 |
| 2016 | $2,692 | $117,902 | $34,243 | $83,659 |
| 2015 | $1,822 | $96,799 | $24,904 | $71,895 |
| 2014 | $1,822 | $96,799 | $24,904 | $71,895 |
Source: Public Records
Map
Nearby Homes
- 702 Pennington St
- 807 Firnat St
- 9026 Mcgallion Rd
- 1207 Firnat St
- 318 Charlock St
- 723 Doverside St
- 415 Briarcliff Dr
- 253 De Boll St
- 249 De Boll St
- 9650 E Hardy Rd
- 216 Burress St
- 219 Heaney Dr
- 202 Burbank St
- 88 Berry Rd
- 411 Berry Rd
- 8411 Berry Brush Ln
- 283 Turner Dr
- 8402 Berry Green Ln
- 9905 Dipping Brook St
- 1104 Charnwood St
- 806 Hurley St
- 811 Pennington St
- 815 Pennington St
- 807 Pennington St
- 802 Hurley St
- 818 Hurley St
- 811 Hurley St
- 803 Pennington St
- 807 Hurley St
- 819 Pennington St
- 815 Hurley St
- 722 Hurley St
- 803 Hurley St
- 819 Hurley St
- 723 Pennington St
- 723 Hurley St
- 718 Hurley St
- 810 Pennington St
- 814 Pennington St
- 806 Pennington St