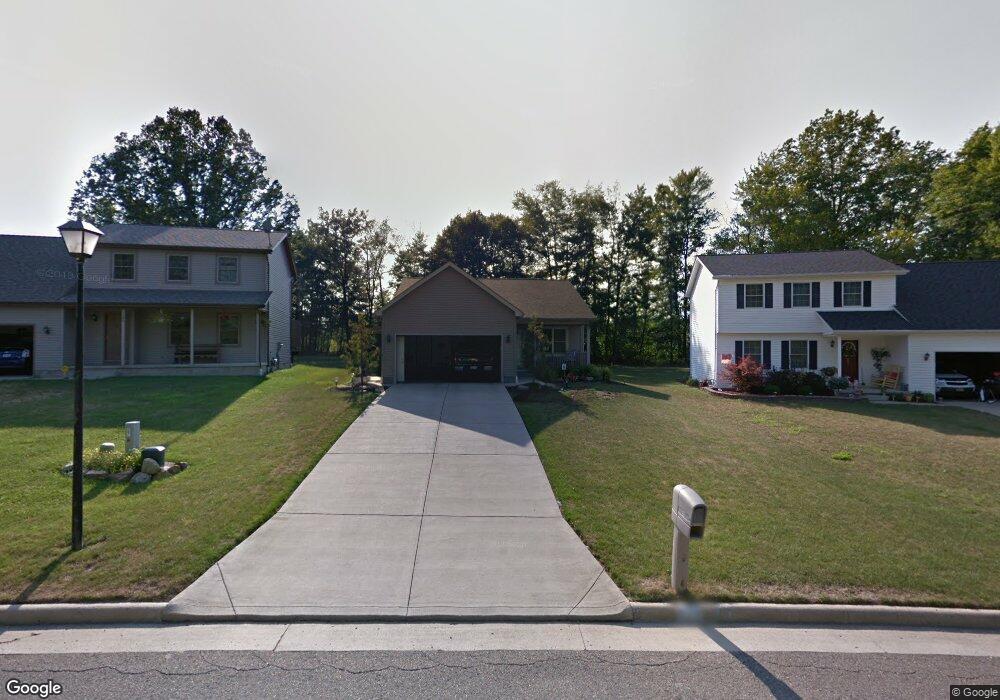
810 Jerry Dr Hubbard, OH 44425
Estimated Value: $202,000 - $274,000
3
Beds
2
Baths
1,340
Sq Ft
$169/Sq Ft
Est. Value
About This Home
This home is located at 810 Jerry Dr, Hubbard, OH 44425 and is currently estimated at $226,684, approximately $169 per square foot. 810 Jerry Dr is a home located in Trumbull County with nearby schools including Hubbard Elementary School, Hubbard Middle School, and Hubbard High School.
Ownership History
Date
Name
Owned For
Owner Type
Purchase Details
Closed on
Sep 2, 2005
Sold by
Clipse William F and Clipse Elaine S
Bought by
Diegan Jack R and Diegan Janet S
Current Estimated Value
Home Financials for this Owner
Home Financials are based on the most recent Mortgage that was taken out on this home.
Original Mortgage
$81,000
Outstanding Balance
$45,186
Interest Rate
5.82%
Mortgage Type
Credit Line Revolving
Estimated Equity
$181,498
Purchase Details
Closed on
Aug 31, 2005
Sold by
Clipse William F and Clipse Elaine S
Bought by
Diegan Jack R and Diegan Janet S
Home Financials for this Owner
Home Financials are based on the most recent Mortgage that was taken out on this home.
Original Mortgage
$81,000
Outstanding Balance
$45,186
Interest Rate
5.82%
Mortgage Type
Credit Line Revolving
Estimated Equity
$181,498
Purchase Details
Closed on
Jun 9, 2005
Sold by
Sovak George E
Bought by
Clipse William F and Clipse Elaine S
Purchase Details
Closed on
Nov 12, 2003
Sold by
Deal Kathleen
Bought by
Sovak George E
Purchase Details
Closed on
Jan 1, 1990
Bought by
Kathleen Deal
Create a Home Valuation Report for This Property
The Home Valuation Report is an in-depth analysis detailing your home's value as well as a comparison with similar homes in the area
Home Values in the Area
Average Home Value in this Area
Purchase History
| Date | Buyer | Sale Price | Title Company |
|---|---|---|---|
| Diegan Jack R | $25,000 | -- | |
| Diegan Jack R | $25,000 | -- | |
| Clipse William F | $25,000 | -- | |
| Sovak George E | $100,000 | -- | |
| Kathleen Deal | -- | -- |
Source: Public Records
Mortgage History
| Date | Status | Borrower | Loan Amount |
|---|---|---|---|
| Open | Sovak George E | $81,000 | |
| Closed | Diegan Jack R | $81,000 |
Source: Public Records
Tax History
| Year | Tax Paid | Tax Assessment Tax Assessment Total Assessment is a certain percentage of the fair market value that is determined by local assessors to be the total taxable value of land and additions on the property. | Land | Improvement |
|---|---|---|---|---|
| 2024 | $2,584 | $62,130 | $7,670 | $54,460 |
| 2023 | $2,555 | $62,130 | $7,670 | $54,460 |
| 2022 | $2,652 | $49,530 | $6,930 | $42,600 |
| 2021 | $2,665 | $49,530 | $6,930 | $42,600 |
| 2020 | $2,677 | $49,530 | $6,930 | $42,600 |
| 2019 | $2,517 | $44,630 | $6,930 | $37,700 |
| 2018 | $2,508 | $44,630 | $6,930 | $37,700 |
| 2017 | $2,501 | $44,630 | $6,930 | $37,700 |
| 2016 | $2,197 | $41,690 | $6,930 | $34,760 |
| 2015 | $2,206 | $41,690 | $6,930 | $34,760 |
| 2014 | $2,155 | $41,690 | $6,930 | $34,760 |
| 2013 | $2,151 | $41,690 | $6,930 | $34,760 |
Source: Public Records
Map
Nearby Homes
- 784 Elmwood Dr
- 868 Saul Dr
- 396 Elizabeth St
- 2974 Schotten Rd
- 132 Drummond Ave
- 7441 Hubbard Bedford Rd
- 228 Stewart St
- 330 Myron St Unit 3
- 135 Clingan St
- 203 Hager St
- 365 Scott St
- 911 Dogwood Dr SE
- 1952 Hubbard Masury Rd
- 601 Wendemere Dr
- 585 Creekside Dr
- 7058 Pine Grove Dr
- 13 Oak Tree Ct
- 11 Clubhouse Dr
- 3516 Roseview Dr
- 6095 Bell Ave
Your Personal Tour Guide
Ask me questions while you tour the home.