Estimated Value: $149,000 - $171,000
3
Beds
2
Baths
1,590
Sq Ft
$100/Sq Ft
Est. Value
About This Home
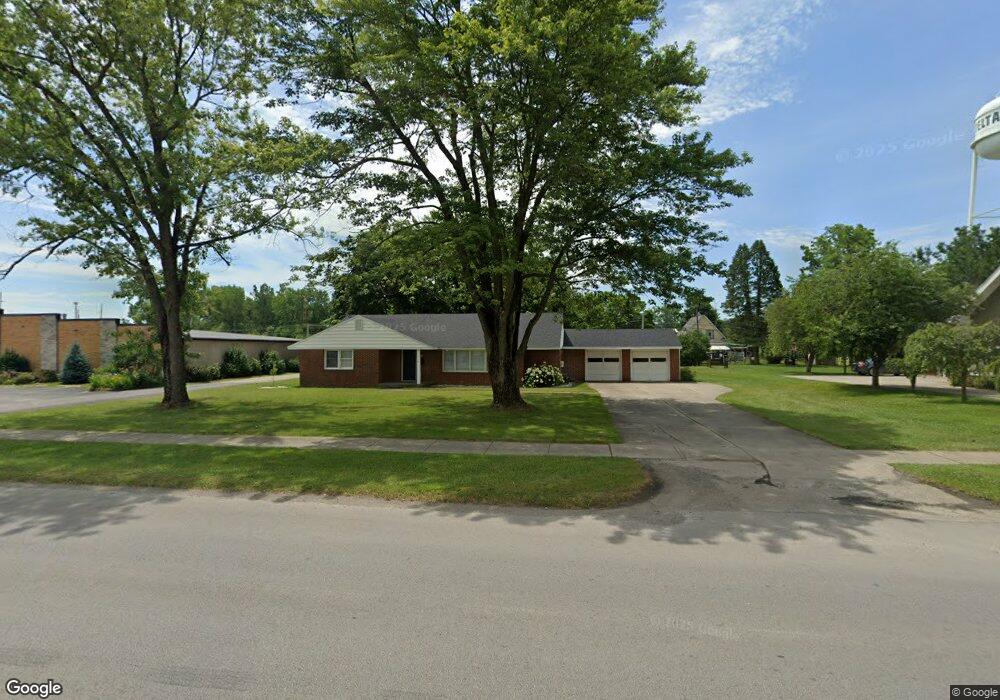
This home is located at 810 Main St, Delta, OH 43515 and is currently estimated at $158,601, approximately $99 per square foot. 810 Main St is a home located in Fulton County with nearby schools including Delta Elementary School, Pike-Delta-York Middle School, and Pike-Delta-York High School.
Ownership History
Date
Name
Owned For
Owner Type
Purchase Details
Closed on
Nov 2, 2018
Sold by
Lytle Madison E and Woodruff Madison E
Bought by
Ryan Zack K
Current Estimated Value
Home Financials for this Owner
Home Financials are based on the most recent Mortgage that was taken out on this home.
Original Mortgage
$126,262
Outstanding Balance
$110,795
Interest Rate
4.7%
Mortgage Type
New Conventional
Estimated Equity
$47,806
Purchase Details
Closed on
Oct 16, 2015
Sold by
Gibbs Gary G
Bought by
Smith Matthew S
Home Financials for this Owner
Home Financials are based on the most recent Mortgage that was taken out on this home.
Original Mortgage
$66,400
Interest Rate
3.91%
Mortgage Type
Future Advance Clause Open End Mortgage
Purchase Details
Closed on
Jan 1, 1990
Bought by
Frank Vernon and Frank Frank
Create a Home Valuation Report for This Property
The Home Valuation Report is an in-depth analysis detailing your home's value as well as a comparison with similar homes in the area
Home Values in the Area
Average Home Value in this Area
Purchase History
| Date | Buyer | Sale Price | Title Company |
|---|---|---|---|
| Ryan Zack K | $125,000 | None Available | |
| Smith Matthew S | $83,000 | Attorney | |
| Frank Vernon | -- | -- |
Source: Public Records
Mortgage History
| Date | Status | Borrower | Loan Amount |
|---|---|---|---|
| Open | Ryan Zack K | $126,262 | |
| Previous Owner | Smith Matthew S | $66,400 |
Source: Public Records
Tax History Compared to Growth
Tax History
| Year | Tax Paid | Tax Assessment Tax Assessment Total Assessment is a certain percentage of the fair market value that is determined by local assessors to be the total taxable value of land and additions on the property. | Land | Improvement |
|---|---|---|---|---|
| 2024 | $1,807 | $41,860 | $8,400 | $33,460 |
| 2023 | $1,807 | $41,860 | $8,400 | $33,460 |
| 2022 | $1,889 | $33,780 | $7,000 | $26,780 |
| 2021 | $1,919 | $33,780 | $7,000 | $26,780 |
| 2020 | $1,941 | $33,780 | $7,000 | $26,780 |
| 2019 | $1,785 | $31,850 | $7,000 | $24,850 |
| 2018 | $1,421 | $31,850 | $7,000 | $24,850 |
| 2017 | $1,408 | $31,850 | $7,000 | $24,850 |
| 2016 | $1,571 | $26,780 | $7,000 | $19,780 |
| 2015 | $1,014 | $26,780 | $7,000 | $19,780 |
| 2014 | $1,020 | $26,780 | $7,000 | $19,780 |
| 2013 | $1,313 | $32,380 | $5,950 | $26,430 |
Source: Public Records
Map
Nearby Homes
- 929 Linwood Ave
- 703 Linwood Ave
- 305 Mckinley St
- 518 Providence St
- 600 Fernwood St
- 11 Meadow Lane Dr
- 421 Providence St
- 413 Fernwood St
- 308 Monroe St
- 500 Sandalwood Ln
- 434 Monroe St
- 106 Adrian St
- 452 Monroe St
- 9163 County Road F
- 5390 County Road D
- 6854 County Road 3
- 3121 County Road Ef
- 7852 County Road C
- 3668 County Road 4
- 2890 County Road 5