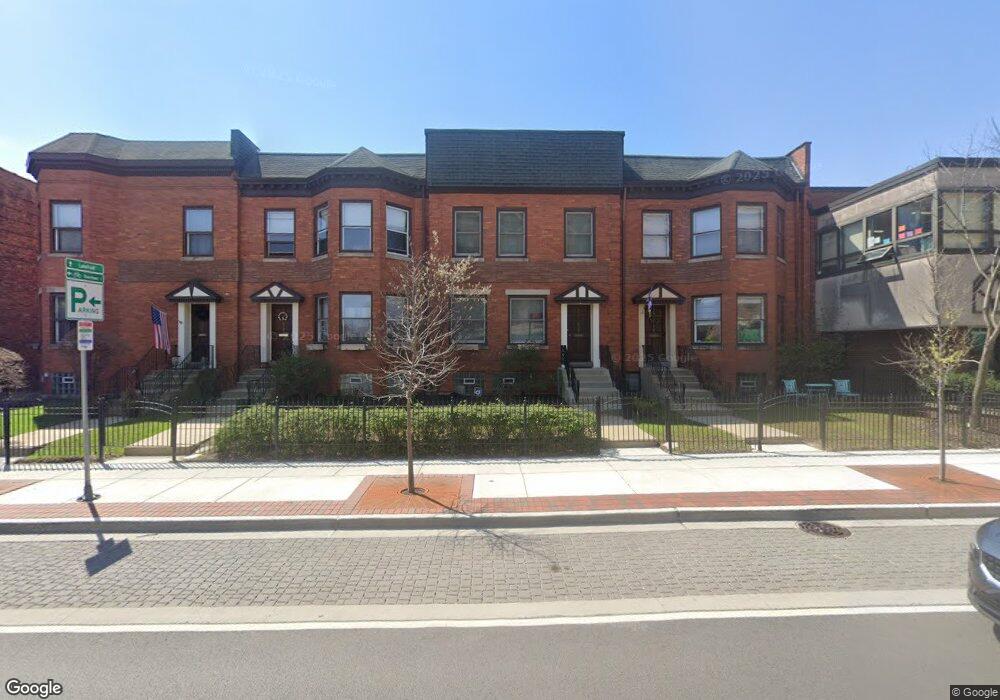
810 Main St Unit 814 Evanston, IL 60202
Southeast Evanston NeighborhoodEstimated Value: $226,282 - $353,000
1
Bed
--
Bath
686
Sq Ft
$434/Sq Ft
Est. Value
About This Home
This home is located at 810 Main St Unit 814, Evanston, IL 60202 and is currently estimated at $297,571, approximately $433 per square foot. 810 Main St Unit 814 is a home located in Cook County with nearby schools including Oakton Elementary School, Chute Middle School, and Evanston Township High School.
Ownership History
Date
Name
Owned For
Owner Type
Purchase Details
Closed on
Apr 28, 2015
Sold by
Burcar Kyle and Archer Melissa
Bought by
Mirintchev Ilian and Mirintchev Sabina
Current Estimated Value
Home Financials for this Owner
Home Financials are based on the most recent Mortgage that was taken out on this home.
Original Mortgage
$164,250
Outstanding Balance
$125,061
Interest Rate
3.68%
Mortgage Type
New Conventional
Estimated Equity
$172,510
Purchase Details
Closed on
Jul 8, 2011
Sold by
Fischer Brian and Fischer Kerri
Bought by
Burcar Kyle and Archer Melissa
Home Financials for this Owner
Home Financials are based on the most recent Mortgage that was taken out on this home.
Original Mortgage
$170,563
Interest Rate
4.52%
Mortgage Type
FHA
Purchase Details
Closed on
Aug 14, 2006
Sold by
Gauthier George A
Bought by
Fischer Brian
Create a Home Valuation Report for This Property
The Home Valuation Report is an in-depth analysis detailing your home's value as well as a comparison with similar homes in the area
Home Values in the Area
Average Home Value in this Area
Purchase History
| Date | Buyer | Sale Price | Title Company |
|---|---|---|---|
| Mirintchev Ilian | $182,500 | First American Title | |
| Burcar Kyle | $175,000 | Attorneys Title Guaranty Fun | |
| Fischer Brian | $190,000 | Ticor Title Insurance Compan |
Source: Public Records
Mortgage History
| Date | Status | Borrower | Loan Amount |
|---|---|---|---|
| Open | Mirintchev Ilian | $164,250 | |
| Previous Owner | Burcar Kyle | $170,563 |
Source: Public Records
Tax History
| Year | Tax Paid | Tax Assessment Tax Assessment Total Assessment is a certain percentage of the fair market value that is determined by local assessors to be the total taxable value of land and additions on the property. | Land | Improvement |
|---|---|---|---|---|
| 2025 | $3,201 | $16,862 | $3,531 | $13,331 |
| 2024 | $3,201 | $16,366 | $3,035 | $13,331 |
| 2023 | $3,046 | $16,366 | $3,035 | $13,331 |
| 2022 | $3,046 | $16,366 | $3,035 | $13,331 |
| 2021 | $2,536 | $12,759 | $1,765 | $10,994 |
| 2020 | $2,562 | $12,759 | $1,765 | $10,994 |
| 2019 | $2,515 | $14,024 | $1,765 | $12,259 |
| 2018 | $4,307 | $18,949 | $1,489 | $17,460 |
| 2017 | $4,210 | $18,949 | $1,489 | $17,460 |
| 2016 | $4,217 | $18,949 | $1,489 | $17,460 |
| 2015 | $4,045 | $17,499 | $1,241 | $16,258 |
| 2014 | $4,021 | $17,499 | $1,241 | $16,258 |
| 2013 | $3,912 | $17,499 | $1,241 | $16,258 |
Source: Public Records
Map
Nearby Homes
- 921 Madison St
- 900 Chicago Ave Unit 609
- 1011 Maple Ave
- 811 Chicago Ave Unit 308
- 901 Hinman Ave Unit 5F
- 801 Hinman Ave Unit 1
- 601 Linden Place Unit 119
- 601 Linden Place Unit 311
- 1122 Sherman Ave
- SAN JUAN GRANDE La Cascabela
- 1049 Hinman Ave
- 834 Seward St Unit 2
- 650 Hinman Ave Unit 2B
- 1314 Main St Unit 2D
- 1315 Main St
- 517 Elmwood Ave
- 1218 Elmwood Ave
- 1003 Wesley Ave
- 222 Main St Unit 504
- 1025 Wesley Ave
- 810 Main St Unit 814
- 814 Main St Unit 814
- 810 Main St Unit 810
- 812 Main St Unit 812
- 814 Main St Unit 1
- 814 1/2 Main St Unit 1
- 816 Main St Unit 816
- 806 Main St Unit 2
- 806 Main St
- 806 Main St Unit 1
- 838 Sherman Ave Unit 13
- 838 Sherman Ave Unit 15
- 838 Sherman Ave Unit 17
- 838 Sherman Ave Unit 12
- 804 Main St
- 836 Sherman Ave Unit 1E
- 836 Sherman Ave Unit 6
- 836 Sherman Ave Unit 9
- 836 Sherman Ave Unit 11
- 836 Sherman Ave Unit 8
Your Personal Tour Guide
Ask me questions while you tour the home.