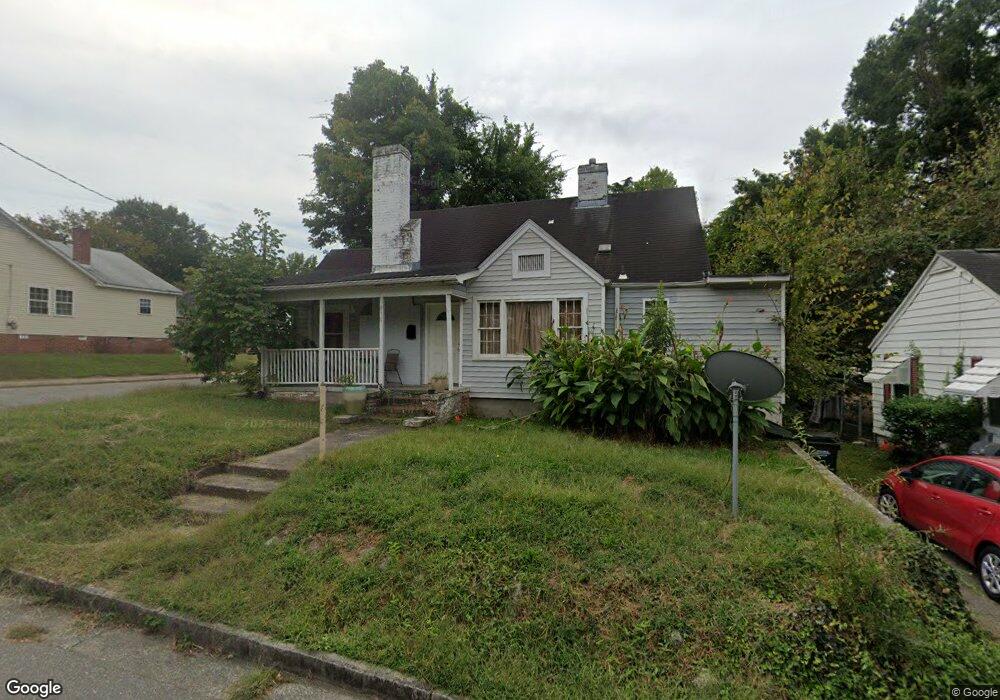
810 Massey Ave Durham, NC 27701
Hayti District NeighborhoodEstimated Value: $153,000 - $270,000
3
Beds
1
Bath
1,124
Sq Ft
$193/Sq Ft
Est. Value
About This Home
This home is located at 810 Massey Ave, Durham, NC 27701 and is currently estimated at $216,877, approximately $192 per square foot. 810 Massey Ave is a home located in Durham County with nearby schools including Fayetteville Street Elementary School, James E. Shepard Middle School, and Hillside High School.
Ownership History
Date
Name
Owned For
Owner Type
Purchase Details
Closed on
Jul 15, 2015
Sold by
Snaptactics Llc
Bought by
Herman David
Current Estimated Value
Purchase Details
Closed on
Jul 13, 2015
Sold by
Suarez Scarlett and Granillo Scarlett
Bought by
Snaptactics Llc
Purchase Details
Closed on
Jul 30, 2013
Sold by
Johnson Courtney K
Bought by
Granillo Scarlett
Purchase Details
Closed on
Jun 22, 2010
Sold by
Secretary Of Housing & Urban Development
Bought by
Johnson Courtney K
Purchase Details
Closed on
Sep 2, 2009
Sold by
Barnes Keith S
Bought by
Secretary Of Housing & Urban Development
Purchase Details
Closed on
Aug 27, 2007
Sold by
Dukes Properties & Development Inc
Bought by
Barnes Keith
Home Financials for this Owner
Home Financials are based on the most recent Mortgage that was taken out on this home.
Original Mortgage
$108,300
Interest Rate
6.65%
Mortgage Type
FHA
Purchase Details
Closed on
Aug 28, 2006
Sold by
Dukes Development & Properties
Bought by
Dukes Properties & Development Inc
Home Financials for this Owner
Home Financials are based on the most recent Mortgage that was taken out on this home.
Original Mortgage
$66,500
Interest Rate
6.67%
Mortgage Type
Purchase Money Mortgage
Purchase Details
Closed on
Jun 5, 2006
Sold by
Reo Properties Corp
Bought by
Dukes Development & Properties
Purchase Details
Closed on
Feb 20, 2006
Sold by
Gachanja Peter
Bought by
Reo Properties Corp
Purchase Details
Closed on
May 1, 2002
Sold by
Graham Lynn E and Graham Felicia Lennon
Bought by
Gachanja Peter
Home Financials for this Owner
Home Financials are based on the most recent Mortgage that was taken out on this home.
Original Mortgage
$71,100
Interest Rate
7.16%
Purchase Details
Closed on
Feb 18, 2002
Sold by
Altegra Credit Company
Bought by
Graham Lynn E and Graham Felicia Lennon
Purchase Details
Closed on
Jul 10, 2001
Sold by
Holeman Caroline M and Holeman Kennith D
Bought by
Altegra Credit Company
Purchase Details
Closed on
Oct 26, 1999
Sold by
Graham Lynn E and Graham Felicia Lennon
Bought by
Holeman Kennith D and Holeman Caroline M
Home Financials for this Owner
Home Financials are based on the most recent Mortgage that was taken out on this home.
Original Mortgage
$85,600
Interest Rate
7.81%
Create a Home Valuation Report for This Property
The Home Valuation Report is an in-depth analysis detailing your home's value as well as a comparison with similar homes in the area
Home Values in the Area
Average Home Value in this Area
Purchase History
| Date | Buyer | Sale Price | Title Company |
|---|---|---|---|
| Herman David | $30,000 | Attorney | |
| Snaptactics Llc | $20,000 | Attorney | |
| Granillo Scarlett | $7,000 | None Available | |
| Johnson Courtney K | -- | None Available | |
| Secretary Of Housing & Urban Development | $120,021 | None Available | |
| Barnes Keith | $110,000 | None Available | |
| Dukes Properties & Development Inc | -- | None Available | |
| Dukes Development & Properties | $41,500 | None Available | |
| Reo Properties Corp | $93,753 | None Available | |
| Gachanja Peter | $79,000 | -- | |
| Graham Lynn E | $39,000 | -- | |
| Altegra Credit Company | $63,000 | -- | |
| Holeman Kennith D | $107,000 | -- |
Source: Public Records
Mortgage History
| Date | Status | Borrower | Loan Amount |
|---|---|---|---|
| Previous Owner | Barnes Keith | $108,300 | |
| Previous Owner | Dukes Properties & Development Inc | $66,500 | |
| Previous Owner | Gachanja Peter | $71,100 | |
| Previous Owner | Holeman Kennith D | $85,600 | |
| Closed | Holeman Kennith D | $10,700 | |
| Closed | Gachanja Peter | $6,900 |
Source: Public Records
Tax History
| Year | Tax Paid | Tax Assessment Tax Assessment Total Assessment is a certain percentage of the fair market value that is determined by local assessors to be the total taxable value of land and additions on the property. | Land | Improvement |
|---|---|---|---|---|
| 2025 | $1,895 | $191,146 | $96,250 | $94,896 |
| 2024 | $865 | $62,008 | $22,020 | $39,988 |
| 2023 | $812 | $62,008 | $22,020 | $39,988 |
| 2022 | $794 | $62,008 | $22,020 | $39,988 |
| 2021 | $790 | $62,008 | $22,020 | $39,988 |
| 2020 | $771 | $62,008 | $22,020 | $39,988 |
| 2019 | $771 | $62,008 | $22,020 | $39,988 |
| 2018 | $656 | $48,336 | $9,909 | $38,427 |
| 2017 | $651 | $48,336 | $9,909 | $38,427 |
| 2016 | $629 | $48,336 | $9,909 | $38,427 |
| 2015 | $1,119 | $80,864 | $13,437 | $67,427 |
| 2014 | -- | $80,864 | $13,437 | $67,427 |
Source: Public Records
Map
Nearby Homes
- 906 Price Ave
- 802 Cox Ave
- 809 Dupree St
- 803 B Dupree St
- 803 A Dupree St
- 1609 Lincoln St
- 909 S Alston Ave
- 805 Ridgeway Ave
- 602 Dunbar St
- 1010 Cole St
- 608 E Umstead St
- 1306 Rosewood St
- 903 Dayton St
- 1608 Fayetteville St
- 431 Eugene St
- 429 Eugene St
- 421 Eugene St Unit A
- 423 Eugene St
- 429 Lakeland St
- 420 Lakeland St
Your Personal Tour Guide
Ask me questions while you tour the home.