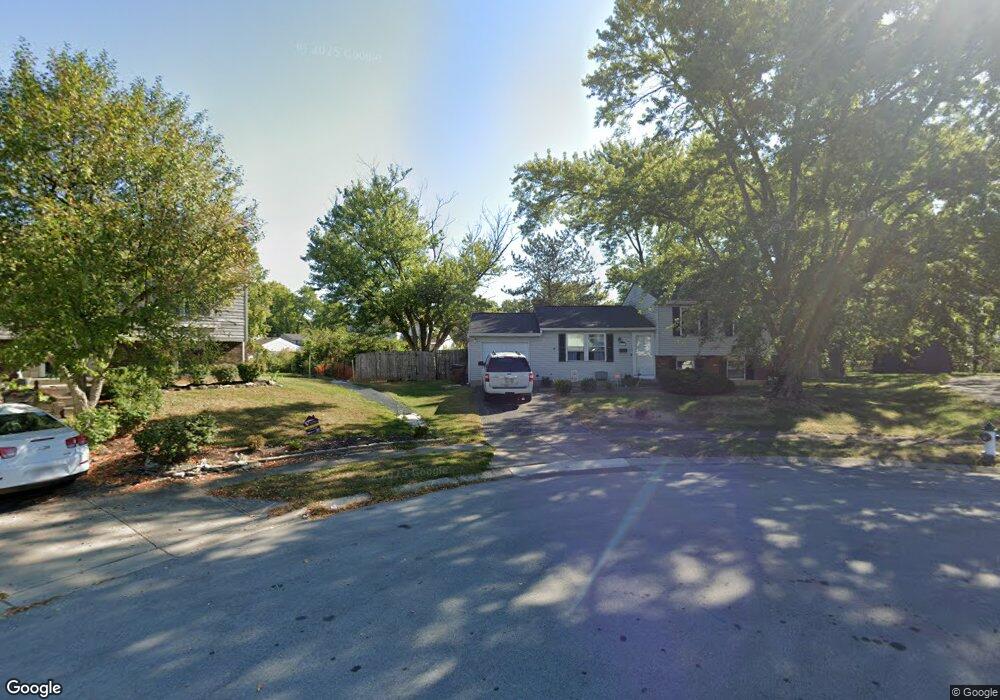
810 Mcgraw Ct Englewood, OH 45322
Estimated Value: $186,000 - $209,000
3
Beds
2
Baths
1,188
Sq Ft
$169/Sq Ft
Est. Value
About This Home
This home is located at 810 Mcgraw Ct, Englewood, OH 45322 and is currently estimated at $200,977, approximately $169 per square foot. 810 Mcgraw Ct is a home located in Montgomery County with nearby schools including Northmont High School, Trotwood Preparatory & Fitness Academy, and Imagine Schools - Woodbury Academy.
Ownership History
Date
Name
Owned For
Owner Type
Purchase Details
Closed on
Feb 6, 2019
Sold by
Traynham Edward E and Planet Home Lending Llc
Bought by
Perry Lisa M
Current Estimated Value
Purchase Details
Closed on
Oct 4, 2010
Sold by
Traynham Edward E
Bought by
Traynham Edward E
Purchase Details
Closed on
Jan 21, 2003
Sold by
Riedy Tonya R
Bought by
Traynham Edward E
Home Financials for this Owner
Home Financials are based on the most recent Mortgage that was taken out on this home.
Original Mortgage
$93,100
Interest Rate
6.13%
Purchase Details
Closed on
Apr 30, 2002
Sold by
Eads Michelle A and Eads Timothy D
Bought by
Traynham Edward E and Riedy Tonya R
Home Financials for this Owner
Home Financials are based on the most recent Mortgage that was taken out on this home.
Original Mortgage
$90,030
Interest Rate
7.18%
Mortgage Type
FHA
Purchase Details
Closed on
May 5, 1994
Sold by
Laprise Linda M
Bought by
Eads Timothy D and Eads Michelle A
Create a Home Valuation Report for This Property
The Home Valuation Report is an in-depth analysis detailing your home's value as well as a comparison with similar homes in the area
Home Values in the Area
Average Home Value in this Area
Purchase History
| Date | Buyer | Sale Price | Title Company |
|---|---|---|---|
| Perry Lisa M | $62,000 | None Available | |
| Traynham Edward E | -- | None Available | |
| Traynham Edward E | -- | -- | |
| Traynham Edward E | $98,000 | -- | |
| Eads Timothy D | -- | -- |
Source: Public Records
Mortgage History
| Date | Status | Borrower | Loan Amount |
|---|---|---|---|
| Previous Owner | Traynham Edward E | $93,100 | |
| Previous Owner | Traynham Edward E | $90,030 |
Source: Public Records
Tax History Compared to Growth
Tax History
| Year | Tax Paid | Tax Assessment Tax Assessment Total Assessment is a certain percentage of the fair market value that is determined by local assessors to be the total taxable value of land and additions on the property. | Land | Improvement |
|---|---|---|---|---|
| 2024 | $1,747 | $61,280 | $13,120 | $48,160 |
| 2023 | $1,747 | $61,280 | $13,120 | $48,160 |
| 2022 | $3,193 | $43,090 | $9,240 | $33,850 |
| 2021 | $3,202 | $43,090 | $9,240 | $33,850 |
| 2020 | $3,142 | $43,090 | $9,240 | $33,850 |
| 2019 | $2,986 | $33,450 | $10,630 | $22,820 |
| 2018 | $2,675 | $33,450 | $10,630 | $22,820 |
| 2017 | $4,462 | $33,450 | $10,630 | $22,820 |
| 2016 | $2,803 | $31,880 | $9,240 | $22,640 |
| 2015 | $2,356 | $31,880 | $9,240 | $22,640 |
| 2014 | $2,356 | $31,880 | $9,240 | $22,640 |
| 2012 | -- | $36,930 | $9,240 | $27,690 |
Source: Public Records
Map
Nearby Homes
- 803 Albert St
- 717 Woodlawn Ave
- 718 Bonnycastle Ave
- 206 Lodestone Dr
- 104 Silverstone Dr
- 510 Lambert Ln
- 510 Rohr Ln
- 520 S Main St
- 109 Silverstone Dr
- 607 Albert St
- 1010 Heathwood Dr
- 534 Unger Ave
- 108 Tate Ave
- 505 Durst Dr
- 208 S Walnut St
- 1017 Terracewood Dr
- 1008 Merrywood Dr
- 916 S Main St
- 206 Gardengrove Way
- 123 Chestnut St