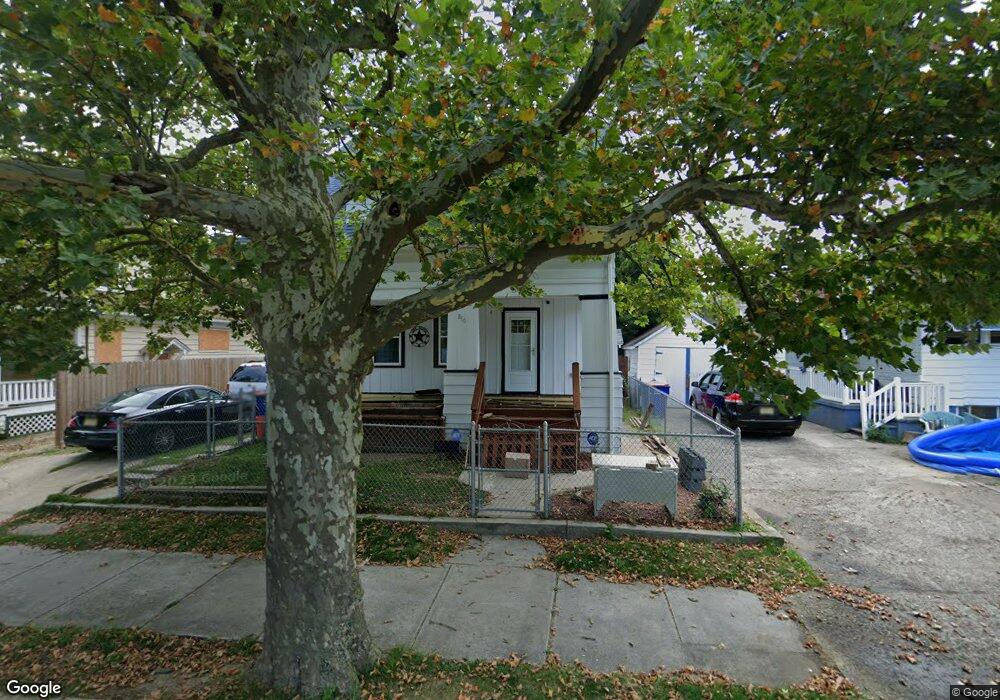
810 N 3rd St Millville, NJ 08332
Estimated Value: $76,000 - $156,000
Studio
--
Bath
776
Sq Ft
$159/Sq Ft
Est. Value
About This Home
This home is located at 810 N 3rd St, Millville, NJ 08332 and is currently estimated at $123,204, approximately $158 per square foot. 810 N 3rd St is a home located in Cumberland County with nearby schools including Silver Run Elementary School, Lakeside Middle School, and Memorial High School.
Ownership History
Date
Name
Owned For
Owner Type
Purchase Details
Closed on
Jun 24, 2016
Sold by
Guy Dorothy R
Bought by
Angel Jennifer M
Current Estimated Value
Home Financials for this Owner
Home Financials are based on the most recent Mortgage that was taken out on this home.
Original Mortgage
$76,684
Outstanding Balance
$63,269
Interest Rate
4.75%
Mortgage Type
FHA
Estimated Equity
$59,935
Purchase Details
Closed on
Jul 31, 1973
Bought by
Guy Dorothy E
Create a Home Valuation Report for This Property
The Home Valuation Report is an in-depth analysis detailing your home's value as well as a comparison with similar homes in the area
Home Values in the Area
Average Home Value in this Area
Purchase History
| Date | Buyer | Sale Price | Title Company |
|---|---|---|---|
| Angel Jennifer M | $31,000 | Freedom Title | |
| Guy Dorothy E | -- | -- |
Source: Public Records
Mortgage History
| Date | Status | Borrower | Loan Amount |
|---|---|---|---|
| Open | Angel Jennifer M | $76,684 |
Source: Public Records
Tax History
| Year | Tax Paid | Tax Assessment Tax Assessment Total Assessment is a certain percentage of the fair market value that is determined by local assessors to be the total taxable value of land and additions on the property. | Land | Improvement |
|---|---|---|---|---|
| 2025 | $2,598 | $66,200 | $17,100 | $49,100 |
| 2024 | $2,598 | $66,200 | $17,100 | $49,100 |
| 2023 | $2,577 | $66,200 | $17,100 | $49,100 |
| 2022 | $2,510 | $66,200 | $17,100 | $49,100 |
| 2021 | $2,241 | $66,200 | $17,100 | $49,100 |
| 2020 | $2,388 | $66,200 | $17,100 | $49,100 |
| 2019 | $2,277 | $66,200 | $17,100 | $49,100 |
| 2018 | $2,230 | $66,200 | $17,100 | $49,100 |
| 2017 | $2,210 | $66,200 | $17,100 | $49,100 |
| 2016 | $2,182 | $66,200 | $17,100 | $49,100 |
| 2015 | $2,133 | $66,200 | $17,100 | $49,100 |
| 2014 | $2,137 | $66,200 | $17,100 | $49,100 |
Source: Public Records
Map
Nearby Homes
Your Personal Tour Guide
Ask me questions while you tour the home.