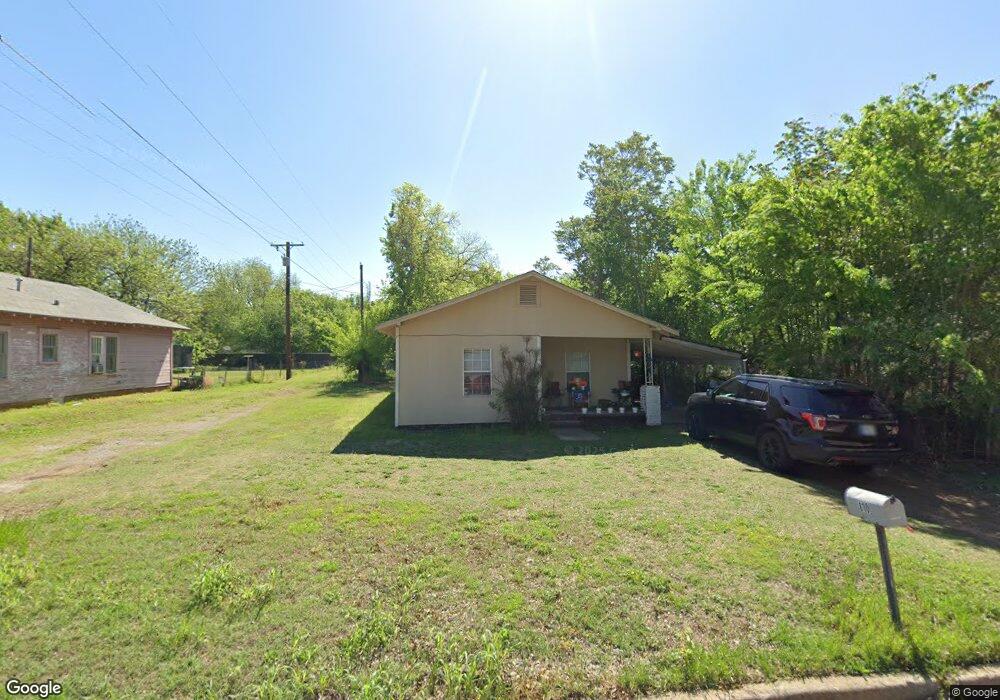
810 N 8th St Duncan, OK 73533
Estimated Value: $40,000 - $83,000
2
Beds
1
Bath
1,182
Sq Ft
$46/Sq Ft
Est. Value
About This Home
This home is located at 810 N 8th St, Duncan, OK 73533 and is currently estimated at $54,253, approximately $45 per square foot. 810 N 8th St is a home located in Stephens County with nearby schools including Emerson Elementary School, Duncan Middle School, and Duncan High School.
Ownership History
Date
Name
Owned For
Owner Type
Purchase Details
Closed on
Jun 10, 2024
Sold by
Baxter Scotty L and Baxter Jana S
Bought by
Baxter Investments Llc
Current Estimated Value
Purchase Details
Closed on
Mar 12, 2024
Sold by
Red Hot Properties Llp
Bought by
Baxter Scotty L and Baxter Jana S
Purchase Details
Closed on
Jun 14, 2018
Sold by
Debusk Casey and Triplet Tara
Bought by
Red Hot Properties Llp
Purchase Details
Closed on
Oct 21, 2014
Sold by
Red Hot Properties Llp and Head Jay
Bought by
Debusk Casey and Triplet Tara
Purchase Details
Closed on
Jun 13, 2011
Sold by
Graham Janice
Bought by
Hit Properties Llp
Purchase Details
Closed on
Apr 7, 2004
Sold by
Huff Doris Patricia
Purchase Details
Closed on
Nov 19, 2003
Sold by
Huff Johnny K
Purchase Details
Closed on
Aug 1, 2002
Sold by
Mcdaniel Ralph A and Mcdaniel Renda
Purchase Details
Closed on
Jul 10, 2002
Sold by
Tomlinson Jerry R and Tomlinson Iane
Purchase Details
Closed on
Nov 27, 1989
Sold by
Tomlinson Richard N
Create a Home Valuation Report for This Property
The Home Valuation Report is an in-depth analysis detailing your home's value as well as a comparison with similar homes in the area
Purchase History
| Date | Buyer | Sale Price | Title Company |
|---|---|---|---|
| Baxter Investments Llc | -- | None Listed On Document | |
| Baxter Scotty L | $115,000 | First American Title | |
| Red Hot Properties Llp | -- | None Available | |
| Debusk Casey | -- | None Available | |
| Hit Properties Llp | -- | None Available | |
| -- | -- | -- | |
| -- | -- | -- | |
| -- | $17,500 | -- | |
| -- | $16,000 | -- | |
| -- | -- | -- |
Source: Public Records
Tax History
| Year | Tax Paid | Tax Assessment Tax Assessment Total Assessment is a certain percentage of the fair market value that is determined by local assessors to be the total taxable value of land and additions on the property. | Land | Improvement |
|---|---|---|---|---|
| 2025 | $376 | $4,465 | $385 | $4,080 |
| 2024 | $181 | $2,122 | $385 | $1,737 |
| 2023 | $181 | $2,121 | $385 | $1,736 |
| 2022 | $164 | $1,924 | $385 | $1,539 |
| 2021 | $222 | $2,618 | $385 | $2,233 |
| 2020 | $205 | $2,375 | $385 | $1,990 |
| 2019 | $234 | $2,703 | $385 | $2,318 |
| 2018 | $256 | $2,880 | $385 | $2,495 |
| 2017 | $248 | $2,880 | $385 | $2,495 |
| 2016 | $289 | $3,397 | $385 | $3,012 |
| 2015 | $215 | $3,397 | $385 | $3,012 |
| 2014 | $215 | $2,677 | $495 | $2,182 |
Source: Public Records
Map
Nearby Homes
- 722 N 8th St
- 1061 N 8th St
- 905 W Pine Ave
- 512 W Pine Ave
- 1275 N 10th St
- 1216 N 8th St
- 1037 W Hickory Ave
- 915 W Chestnut Ave
- 809 W Beech Ave
- 1112 N 4th St
- 1112 N 12th St
- 509 N 3rd St
- 1205 N 11th St
- 1202 N 12th St
- 1309 W Spruce Ave
- 1315 W Spruce Ave
- 1125 Peck Ave
- 1106 W Ash Ave
- 512 W Oak Ave
- 1001 W Jones Ave
- 806 N 8th St
- 810 810 N 8th St
- 1452 N 8th St
- 1729 N Waterplant Rd
- 713 W Cedar Ave
- 1464 N 8th St
- 802 N 8th St
- 711 W Cedar Ave
- 712 W Spruce Ave
- 716 W Spruce Ave
- 818 N 8th St
- 714 W Spruce Ave
- 809 N 8th St
- 709 W Cedar Ave
- 811 811 N 8th
- 811 N 8th St
- 708 W Spruce Ave
- 813 813 N 8th
- 803 W Cedar Ave
- 813 N 8th St
Your Personal Tour Guide
Ask me questions while you tour the home.