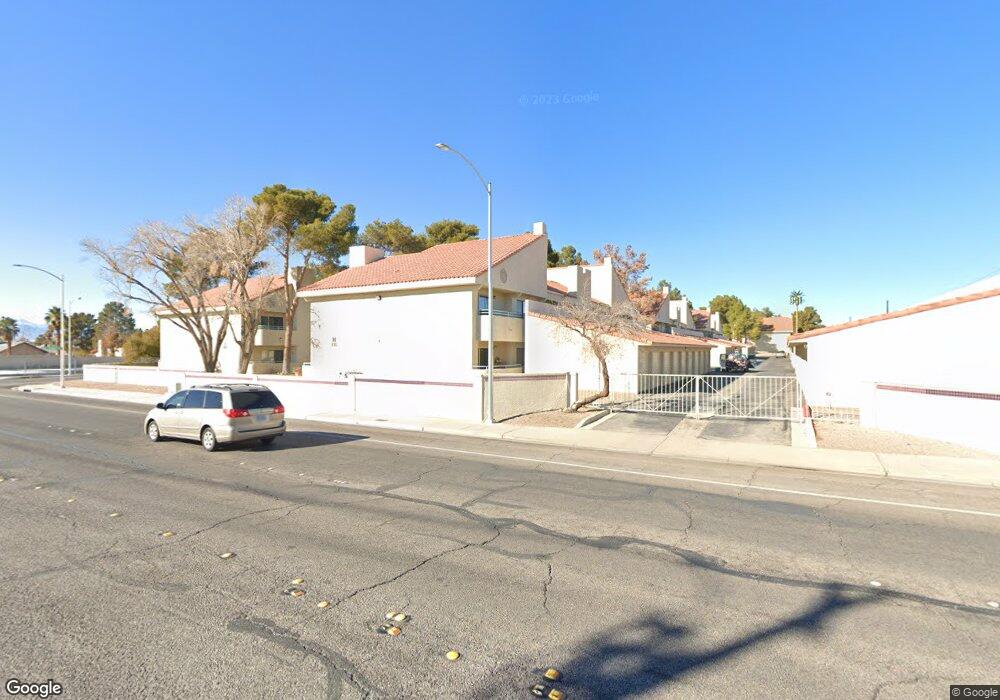
810 N Sloan Ln Unit 104 Las Vegas, NV 89110
Estimated Value: $144,000 - $198,491
3
Beds
2
Baths
1,068
Sq Ft
$171/Sq Ft
Est. Value
About This Home
This home is located at 810 N Sloan Ln Unit 104, Las Vegas, NV 89110 and is currently estimated at $182,373, approximately $170 per square foot. 810 N Sloan Ln Unit 104 is a home located in Clark County with nearby schools including Eileen Brookman Elementary School, Dr. William H. Bailey Middle School, and Eldorado High School.
Ownership History
Date
Name
Owned For
Owner Type
Purchase Details
Closed on
Jan 14, 2015
Sold by
Castillo Xochiltz
Bought by
Duran Dorian A
Current Estimated Value
Home Financials for this Owner
Home Financials are based on the most recent Mortgage that was taken out on this home.
Original Mortgage
$50,000
Interest Rate
3.87%
Mortgage Type
New Conventional
Purchase Details
Closed on
Nov 28, 2014
Sold by
Andrews Leo F
Bought by
Duron Dorian A
Home Financials for this Owner
Home Financials are based on the most recent Mortgage that was taken out on this home.
Original Mortgage
$50,000
Interest Rate
3.87%
Mortgage Type
New Conventional
Purchase Details
Closed on
Oct 28, 1994
Sold by
Bastone Robert P and Bastone Joanna
Bought by
Andrews Leo F and Andrews Barbara J
Purchase Details
Closed on
Sep 28, 1993
Sold by
Bastone John
Bought by
Bastone Robert P and Bastone Joanna
Create a Home Valuation Report for This Property
The Home Valuation Report is an in-depth analysis detailing your home's value as well as a comparison with similar homes in the area
Home Values in the Area
Average Home Value in this Area
Purchase History
| Date | Buyer | Sale Price | Title Company |
|---|---|---|---|
| Duran Dorian A | -- | Ticor Title Las Vegas | |
| Duron Dorian A | $60,000 | Ticor Title Las Vegas | |
| Andrews Leo F | $73,500 | Stewart Title | |
| Bastone Robert P | -- | -- |
Source: Public Records
Mortgage History
| Date | Status | Borrower | Loan Amount |
|---|---|---|---|
| Previous Owner | Duron Dorian A | $50,000 |
Source: Public Records
Tax History Compared to Growth
Tax History
| Year | Tax Paid | Tax Assessment Tax Assessment Total Assessment is a certain percentage of the fair market value that is determined by local assessors to be the total taxable value of land and additions on the property. | Land | Improvement |
|---|---|---|---|---|
| 2025 | $555 | $36,502 | $13,650 | $22,852 |
| 2024 | $515 | $36,502 | $13,650 | $22,852 |
| 2023 | $342 | $37,937 | $16,450 | $21,487 |
| 2022 | $477 | $34,720 | $14,700 | $20,020 |
| 2021 | $442 | $31,436 | $11,900 | $19,536 |
| 2020 | $407 | $32,131 | $12,600 | $19,531 |
| 2019 | $382 | $28,757 | $9,100 | $19,657 |
| 2018 | $364 | $24,904 | $5,600 | $19,304 |
| 2017 | $687 | $23,427 | $4,900 | $18,527 |
| 2016 | $342 | $24,098 | $3,850 | $20,248 |
| 2015 | $340 | $15,544 | $3,150 | $12,394 |
| 2014 | $330 | $11,952 | $2,450 | $9,502 |
Source: Public Records
Map
Nearby Homes
- 910 N Sloan Ln Unit 201
- 920 N Sloan Ln Unit 204
- 740 Santree Cir
- 741 Round Table Dr
- 5923 Halehaven Dr
- 6030 Halehaven Dr
- 796 Ringwood Ln
- 5717 Christchurch Ave
- 6218 Sapporo Cir
- 6235 Sapporo Cir
- 563 Moon Chase St
- 5802 Queenstown Way
- 6209 Exquisite Ave
- 0 Washington Unit 2360795
- 730 N Christy Ln
- 656 N Christy Ln
- 1083 Devon Lake St
- 5529 Cedar Ave
- 522 Wheaties Way
- 5855 Feather Falls Cir
- 810 N Sloan Ln Unit 103
- 810 N Sloan Ln Unit 102
- 810 N Sloan Ln Unit 203H
- 810 N Sloan Ln Unit 101
- 810 N Sloan Ln Unit LN201H
- 810 N Sloan Ln Unit 204H
- 810 N Sloan Ln Unit 202
- 820 N Sloan Ln Unit 106
- 820 N Sloan Ln Unit 201
- 820 N Sloan Ln Unit 204
- 820 N Sloan Ln Unit 102
- 820 N Sloan Ln Unit 205
- 820 N Sloan Ln Unit 202
- 820 N Sloan Ln Unit 105
- 820 N Sloan Ln Unit 203
- 820 N Sloan Ln Unit 101
- 820 N Sloan Ln Unit 103
- 820 N Sloan Ln Unit 104
- 820 N Sloan Ln Unit 206
- 830 N Sloan Ln Unit 204G