Estimated Value: $124,000 - $159,000
3
Beds
1
Bath
1,204
Sq Ft
$118/Sq Ft
Est. Value
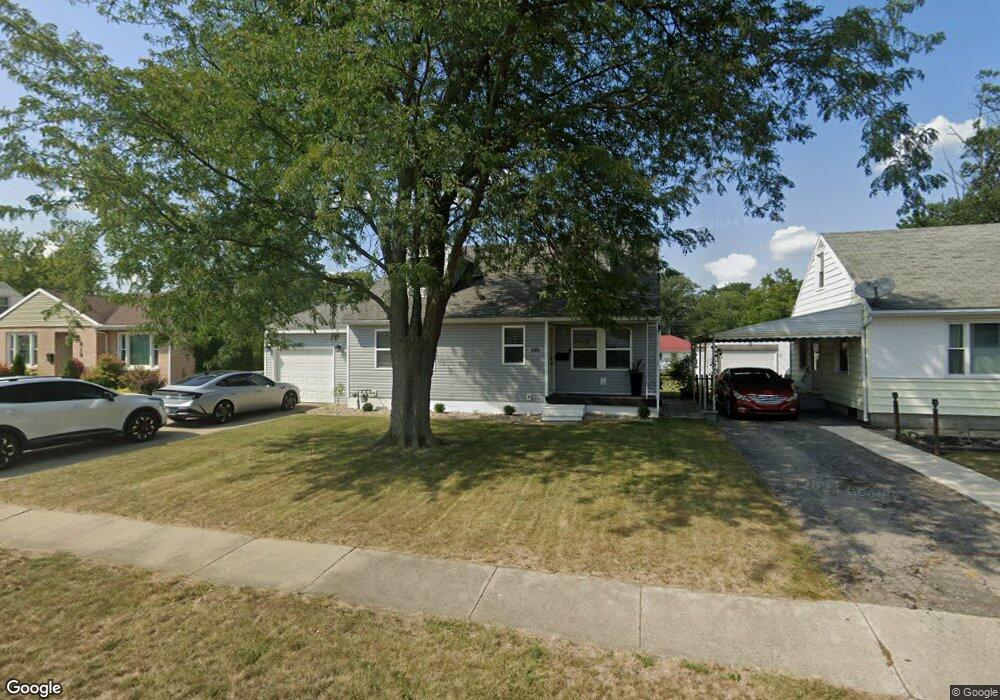
About This Home
This home is located at 810 Runyan Ave, Lima, OH 45801 and is currently estimated at $141,783, approximately $117 per square foot. 810 Runyan Ave is a home located in Allen County with nearby schools including Independence Elementary School, Lima North Middle School, and Lima West Middle School.
Ownership History
Date
Name
Owned For
Owner Type
Purchase Details
Closed on
Mar 20, 2024
Sold by
Wireman Bryan L and Wireman Maryann
Bought by
Welch Cheyenne
Current Estimated Value
Purchase Details
Closed on
Jun 30, 2006
Sold by
Halker Brad A and Halker Taneka N
Bought by
Wireman Bryan L
Home Financials for this Owner
Home Financials are based on the most recent Mortgage that was taken out on this home.
Original Mortgage
$83,300
Interest Rate
6.73%
Mortgage Type
Purchase Money Mortgage
Purchase Details
Closed on
Apr 30, 2001
Sold by
Bollinger Brian J
Bought by
Halker Brad A
Home Financials for this Owner
Home Financials are based on the most recent Mortgage that was taken out on this home.
Original Mortgage
$75,810
Interest Rate
7.03%
Mortgage Type
FHA
Purchase Details
Closed on
Aug 1, 1983
Bought by
Bollinger Brian J
Create a Home Valuation Report for This Property
The Home Valuation Report is an in-depth analysis detailing your home's value as well as a comparison with similar homes in the area
Purchase History
| Date | Buyer | Sale Price | Title Company |
|---|---|---|---|
| Welch Cheyenne | $100,000 | None Listed On Document | |
| Wireman Bryan L | $84,500 | None Available | |
| Halker Brad A | $77,000 | -- | |
| Bollinger Brian J | $39,000 | -- |
Source: Public Records
Mortgage History
| Date | Status | Borrower | Loan Amount |
|---|---|---|---|
| Previous Owner | Wireman Bryan L | $83,300 | |
| Previous Owner | Halker Brad A | $75,810 |
Source: Public Records
Tax History
| Year | Tax Paid | Tax Assessment Tax Assessment Total Assessment is a certain percentage of the fair market value that is determined by local assessors to be the total taxable value of land and additions on the property. | Land | Improvement |
|---|---|---|---|---|
| 2024 | $1,425 | $39,630 | $4,870 | $34,760 |
| 2023 | $1,124 | $26,780 | $3,290 | $23,490 |
| 2022 | $1,174 | $27,900 | $3,290 | $24,610 |
| 2021 | $1,242 | $27,900 | $3,290 | $24,610 |
| 2020 | $1,249 | $24,890 | $3,190 | $21,700 |
| 2019 | $1,249 | $24,890 | $3,190 | $21,700 |
| 2018 | $1,231 | $24,890 | $3,190 | $21,700 |
| 2017 | $1,150 | $22,720 | $3,190 | $19,530 |
| 2016 | $1,160 | $22,720 | $3,190 | $19,530 |
| 2015 | $1,188 | $22,720 | $3,190 | $19,530 |
| 2014 | $1,112 | $21,460 | $3,050 | $18,410 |
| 2013 | $1,082 | $21,460 | $3,050 | $18,410 |
Source: Public Records
Map
Nearby Homes
- 760 W O'Connor Ave
- 645 W O'Connor Ave
- 608 W O'Connor Ave
- 576 W Ashton Ave
- 557 W Ashton Ave
- 1027 Sherman Ave
- 1212 Virginia Ave
- 1317 Virginia Ave
- 607 W Grand Ave
- 1889 N Metcalf St
- 1021 N McDonel St
- 934 N Metcalf St
- 841 N Baxter St
- 816 N Baxter St
- 1164 Bahama Dr
- 406 Ewing Ave
- 631 Hazel Ave
- 316 Ewing Ave
- 435 Marian Ave
- 0 Latham
- 818 Runyan Ave
- 802 Runyan Ave
- 826 Runyan Ave
- 796 Runyan Ave
- 805 W Oconnor Ave
- 805 W Oconnor Ave
- 803 W Oconnor Ave
- 809 W Oconnor Ave
- 834 Runyan Ave
- 801 W Oconnor Ave
- 801 W Oconnor Ave
- 803 Runyan Ave
- 760 Runyan Ave
- 811 Runyan Ave
- 813 W Oconnor Ave
- 765 W Oconnor Ave
- 799 Runyan Ave
- 819 Runyan Ave
- 838 Runyan Ave
Your Personal Tour Guide
Ask me questions while you tour the home.