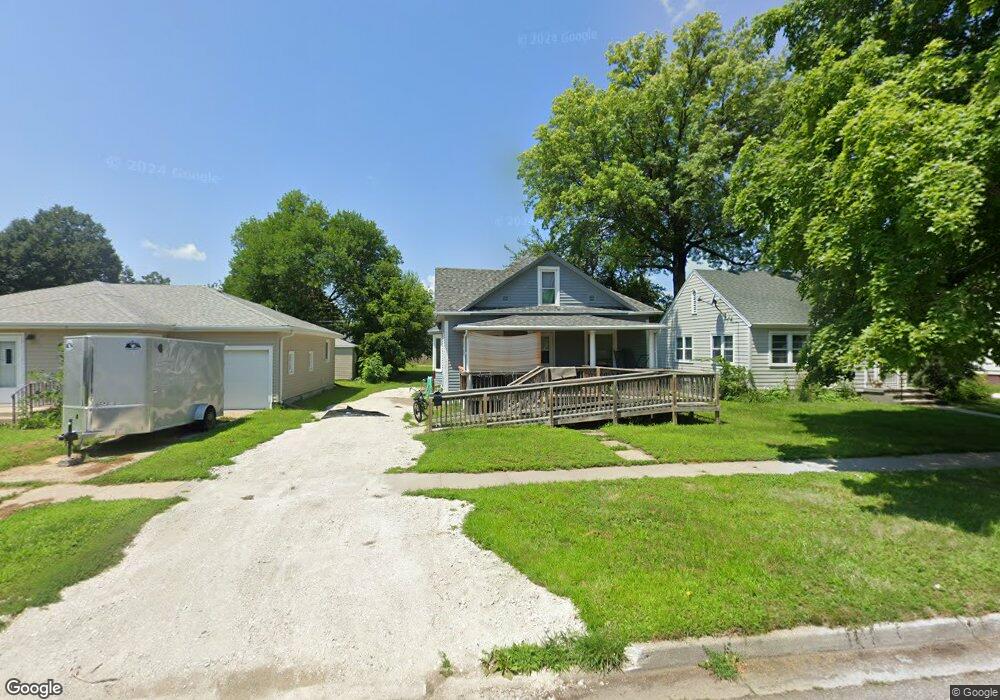
810 S 2nd St Norfolk, NE 68701
Estimated Value: $134,000 - $156,000
2
Beds
1
Bath
948
Sq Ft
$150/Sq Ft
Est. Value
About This Home
This home is located at 810 S 2nd St, Norfolk, NE 68701 and is currently estimated at $142,465, approximately $150 per square foot. 810 S 2nd St is a home located in Madison County with nearby schools including Norfolk Senior High School, Christ Lutheran School, and Keystone Christian Academy.
Ownership History
Date
Name
Owned For
Owner Type
Purchase Details
Closed on
May 14, 2005
Sold by
Chase Manhattan Bank
Bought by
Stevens Scott D and Stevens Angela M
Current Estimated Value
Home Financials for this Owner
Home Financials are based on the most recent Mortgage that was taken out on this home.
Original Mortgage
$18,000
Interest Rate
5.87%
Mortgage Type
New Conventional
Purchase Details
Closed on
Apr 29, 2005
Sold by
Chase Manhattan Bank Tr The
Bought by
Stevens Scott D and Stevens Angela M
Home Financials for this Owner
Home Financials are based on the most recent Mortgage that was taken out on this home.
Original Mortgage
$18,000
Interest Rate
5.87%
Mortgage Type
New Conventional
Purchase Details
Closed on
Feb 23, 2005
Sold by
Christ Laurie and Martinez Julio C
Bought by
Chase Manhattan Bank
Purchase Details
Closed on
Feb 15, 2005
Sold by
Martinez Julio C
Bought by
Chase Manhattan Bank Tr The
Purchase Details
Closed on
May 31, 2000
Sold by
Plummer Roger L and Plummer Nancy J
Bought by
Martinez Julio C
Create a Home Valuation Report for This Property
The Home Valuation Report is an in-depth analysis detailing your home's value as well as a comparison with similar homes in the area
Home Values in the Area
Average Home Value in this Area
Purchase History
| Date | Buyer | Sale Price | Title Company |
|---|---|---|---|
| Stevens Scott D | $21,000 | Northeast Nebr Title | |
| Stevens Scott D | $20,001 | -- | |
| Chase Manhattan Bank | -- | None Available | |
| Chase Manhattan Bank Tr The | $29,084 | -- | |
| Martinez Julio C | $29,900 | -- |
Source: Public Records
Mortgage History
| Date | Status | Borrower | Loan Amount |
|---|---|---|---|
| Closed | Stevens Scott D | $18,000 |
Source: Public Records
Tax History Compared to Growth
Tax History
| Year | Tax Paid | Tax Assessment Tax Assessment Total Assessment is a certain percentage of the fair market value that is determined by local assessors to be the total taxable value of land and additions on the property. | Land | Improvement |
|---|---|---|---|---|
| 2024 | $1,131 | $90,493 | $11,881 | $78,612 |
| 2023 | $1,495 | $80,839 | $11,881 | $68,958 |
| 2022 | $1,361 | $73,451 | $11,881 | $61,570 |
| 2021 | $1,237 | $66,854 | $11,881 | $54,973 |
| 2020 | $1,125 | $60,964 | $11,881 | $49,083 |
| 2019 | $1,064 | $55,705 | $11,881 | $43,824 |
| 2018 | $914 | $48,634 | $9,505 | $39,129 |
| 2017 | $854 | $45,403 | $9,505 | $35,898 |
| 2016 | $764 | $40,539 | $8,487 | $32,052 |
| 2015 | $764 | $40,539 | $8,487 | $32,052 |
| 2014 | $787 | $40,539 | $8,487 | $32,052 |
| 2013 | $770 | $38,442 | $8,487 | $29,955 |
Source: Public Records
Map
Nearby Homes