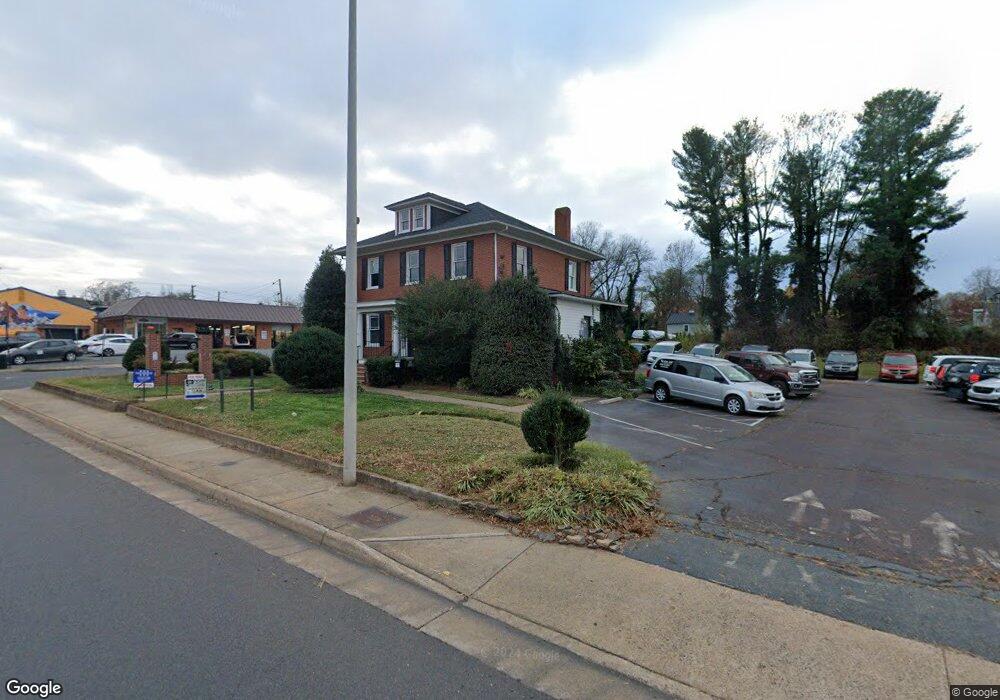
810 S Main St Culpeper, VA 22701
Estimated Value: $810,649
5
Beds
1
Bath
2,528
Sq Ft
$321/Sq Ft
Est. Value
About This Home
This home is located at 810 S Main St, Culpeper, VA 22701 and is currently estimated at $810,649, approximately $320 per square foot. 810 S Main St is a home located in Culpeper County with nearby schools including Farmington Elementary School, Floyd T. Binns Middle School, and Eastern View High School.
Ownership History
Date
Name
Owned For
Owner Type
Purchase Details
Closed on
Jun 14, 2023
Sold by
Thornlea Real Estate Holdings Llc
Bought by
Nova Group Llc
Current Estimated Value
Purchase Details
Closed on
Nov 29, 2017
Sold by
Crossroads Properties Llc A Virginia Lim
Bought by
Thornlea Real Estate Holdings Llc A Virg
Home Financials for this Owner
Home Financials are based on the most recent Mortgage that was taken out on this home.
Original Mortgage
$475,000
Interest Rate
3.88%
Mortgage Type
Purchase Money Mortgage
Create a Home Valuation Report for This Property
The Home Valuation Report is an in-depth analysis detailing your home's value as well as a comparison with similar homes in the area
Purchase History
| Date | Buyer | Sale Price | Title Company |
|---|---|---|---|
| Nova Group Llc | $742,500 | Old Republic National Title | |
| Thornlea Real Estate Holdings Llc A Virg | $525,000 | Attorney |
Source: Public Records
Mortgage History
| Date | Status | Borrower | Loan Amount |
|---|---|---|---|
| Previous Owner | Thornlea Real Estate Holdings Llc A Virg | $475,000 |
Source: Public Records
Tax History
| Year | Tax Paid | Tax Assessment Tax Assessment Total Assessment is a certain percentage of the fair market value that is determined by local assessors to be the total taxable value of land and additions on the property. | Land | Improvement |
|---|---|---|---|---|
| 2025 | $3,846 | $697,000 | $268,800 | $428,200 |
| 2024 | $3,846 | $496,400 | $182,500 | $313,900 |
| 2023 | $2,491 | $419,000 | $182,500 | $236,500 |
| 2022 | $2,089 | $379,900 | $182,500 | $197,400 |
| 2021 | $2,401 | $379,900 | $182,500 | $197,400 |
| 2020 | $2,190 | $353,300 | $182,500 | $170,800 |
| 2019 | $2,190 | $353,300 | $182,500 | $170,800 |
| 2018 | $2,281 | $340,400 | $182,500 | $157,900 |
| 2017 | $2,281 | $340,400 | $182,500 | $157,900 |
| 2016 | $2,280 | $314,000 | $158,200 | $155,800 |
| 2015 | $2,280 | $312,300 | $158,200 | $154,100 |
| 2014 | $2,885 | $300,500 | $158,200 | $142,300 |
Source: Public Records
Map
Nearby Homes
- 802 S Main St
- 1012 S Main St
- 609 S West St
- 601 S West St
- 139 Oak View St
- 222 W Park Ave
- 802 S Blue Ridge Ave
- 712 S Blue Ridge Ave
- 1314 S West St
- 503 MacOy Ave
- 0 West
- 501 Germanna Hwy
- 1417 Orange Rd
- 1756 Scenic Loop
- 121 W Piedmont St
- 0 Keyser Rd Unit VACU2009706
- 863 Fox Den Rd
- 1790 Scenic Loop
- 1724 Scenic Loop
- 610 Kingsbrook Rd
Your Personal Tour Guide
Ask me questions while you tour the home.