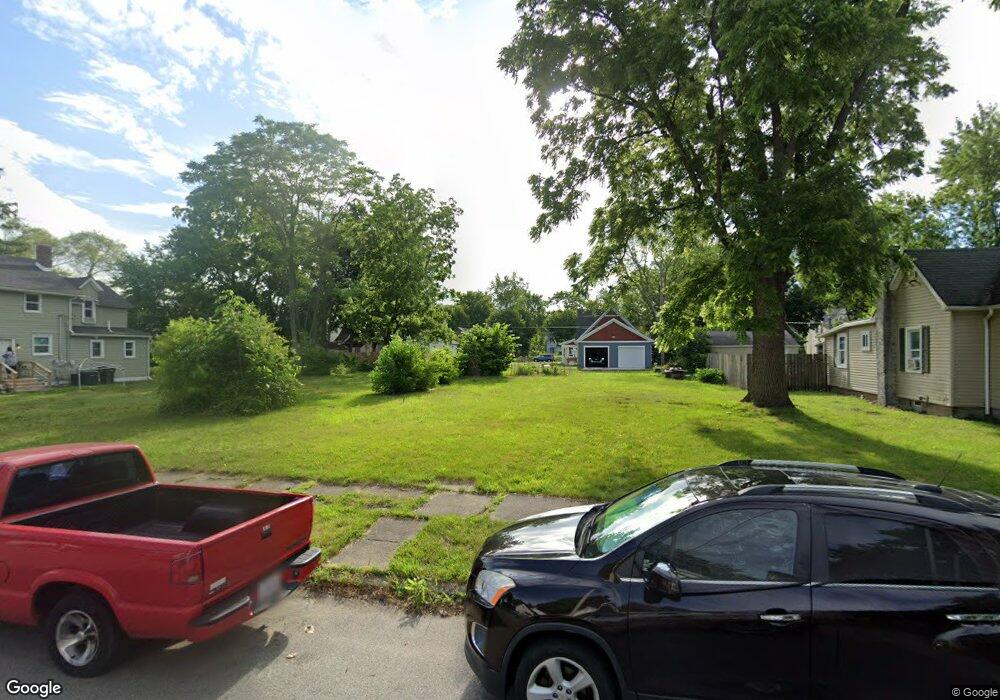
810 Sherman Ave South Bend, IN 46616
Near Northwest NeighborhoodEstimated Value: $158,000
3
Beds
1
Bath
1,626
Sq Ft
$97/Sq Ft
Est. Value
About This Home
This home is located at 810 Sherman Ave, South Bend, IN 46616 and is currently estimated at $158,000, approximately $97 per square foot. 810 Sherman Ave is a home located in St. Joseph County with nearby schools including Muessel Primary Center, Clay Intermediate Center, and Edison Middle School.
Ownership History
Date
Name
Owned For
Owner Type
Purchase Details
Closed on
Nov 6, 2020
Sold by
Kingdom Life Christian Cathedral Inc
Bought by
Village To Village International Inc
Current Estimated Value
Purchase Details
Closed on
May 16, 2018
Sold by
Auditor Of St Joseph County
Bought by
Kingdom Life Christian Cathedr
Purchase Details
Closed on
Dec 5, 2017
Sold by
St Joseph County Auditor
Bought by
Kingdom Life Christian Cathedr
Purchase Details
Closed on
Mar 16, 2010
Sold by
Moore Clinton
Bought by
Howard Brandon
Purchase Details
Closed on
Nov 6, 2008
Sold by
Peoples Choice National Homes Inc
Bought by
Moore Clinton
Purchase Details
Closed on
Aug 6, 2008
Sold by
Green Safari Llc
Bought by
People Choice Natiaonl Homes Inc
Purchase Details
Closed on
Sep 20, 2006
Sold by
Black Donald E and Black Vicki L
Bought by
Green Safari Llc
Create a Home Valuation Report for This Property
The Home Valuation Report is an in-depth analysis detailing your home's value as well as a comparison with similar homes in the area
Home Values in the Area
Average Home Value in this Area
Purchase History
| Date | Buyer | Sale Price | Title Company |
|---|---|---|---|
| Village To Village International Inc | -- | None Available | |
| Village To Village International Inc | -- | None Available | |
| Kingdom Life Christian Cathedr | $729 | None Listed On Document | |
| Kingdom Life Christian Cathedr | $729 | None Available | |
| Howard Brandon | -- | Metropolitan Title In Llc | |
| Moore Clinton | -- | None Available | |
| People Choice Natiaonl Homes Inc | -- | Metropolitan Title In Llc | |
| Green Safari Llc | -- | Metropolitan Title In Llc |
Source: Public Records
Tax History Compared to Growth
Tax History
| Year | Tax Paid | Tax Assessment Tax Assessment Total Assessment is a certain percentage of the fair market value that is determined by local assessors to be the total taxable value of land and additions on the property. | Land | Improvement |
|---|---|---|---|---|
| 2024 | $332 | $9,800 | $9,800 | -- |
| 2023 | $333 | $9,800 | $9,800 | $0 |
| 2022 | $333 | $9,800 | $9,800 | $0 |
| 2021 | $122 | $3,600 | $3,600 | $0 |
| 2020 | $92 | $2,700 | $2,700 | $0 |
| 2019 | $81 | $2,700 | $2,700 | $0 |
| 2018 | $91 | $2,700 | $2,700 | $0 |
| 2017 | $95 | $2,700 | $2,700 | $0 |
| 2016 | $136 | $2,700 | $2,700 | $0 |
| 2014 | $1,398 | $53,500 | $3,100 | $50,400 |
Source: Public Records
Map
Nearby Homes
- 816 Allen St
- 745 Allen St
- 919 Allen St
- 715 Blaine Ave
- 716 Blaine Ave
- 740 Cleveland Ave
- 1052 Portage Ave
- 920 Cleveland Ave
- 711 Blaine Ave
- 703 Portage Ct
- 1040 Woodward Ave
- 1116 Allen St
- 1209 Poplar St
- 1102 Diamond Ave
- 1201 Allen St
- 524 Euclid Ave
- 529 Euclid Ave
- 617 N Walnut St
- 1245 Woodward Ave
- 661 Lawndale Ave
- 806 Sherman Ave
- 820 Sherman Ave
- 809 Harrison Ave
- 807 Harrison Ave
- 824 Sherman Ave
- 805 Harrison Ave
- 817 Harrison Ave
- 803 Harrison Ave
- 809 Sherman Ave
- 811 Sherman Ave
- 807 Sherman Ave
- 821 Harrison Ave
- 813 Sherman Ave
- 1020 Van Buren St
- 1022 Van Buren St
- 823 Harrison Ave
- 815 Sherman Ave
- 904 Sherman Ave
- 750 Sherman Ave
- 901 Harrison Ave