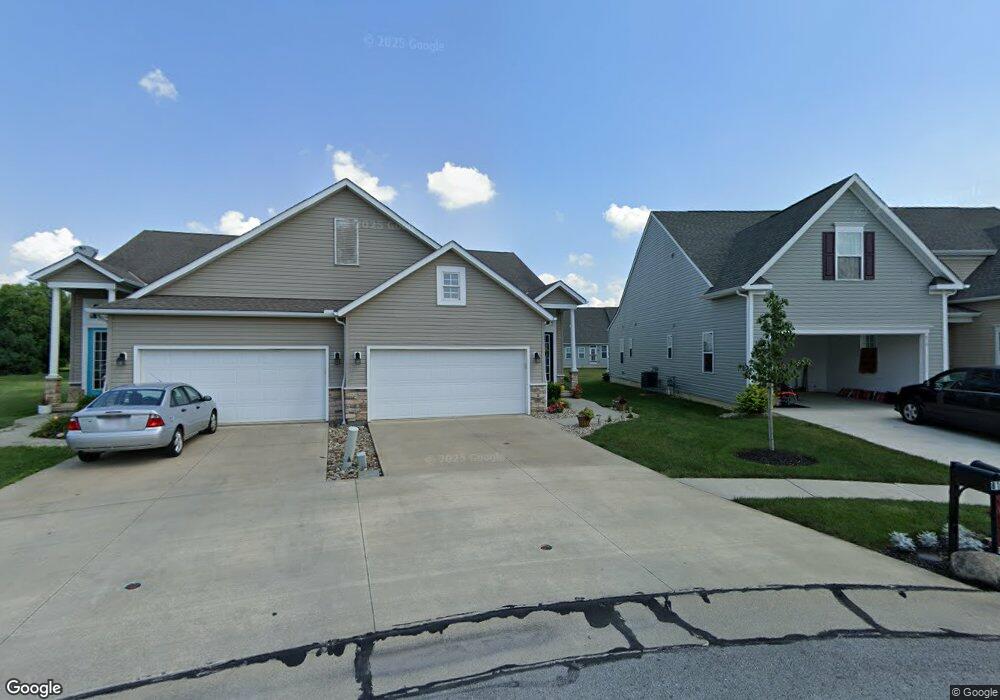
810 Walcutt Ct Lagrange, OH 44050
Estimated Value: $314,028 - $357,000
3
Beds
3
Baths
1,825
Sq Ft
$182/Sq Ft
Est. Value
About This Home
This home is located at 810 Walcutt Ct, Lagrange, OH 44050 and is currently estimated at $333,007, approximately $182 per square foot. 810 Walcutt Ct is a home located in Lorain County with nearby schools including Keystone Elementary School, Keystone Middle School, and Keystone High School.
Ownership History
Date
Name
Owned For
Owner Type
Purchase Details
Closed on
Apr 15, 2019
Sold by
Nvr Inc
Bought by
Weller M Lucille and Young Shannon R
Current Estimated Value
Home Financials for this Owner
Home Financials are based on the most recent Mortgage that was taken out on this home.
Original Mortgage
$133,025
Outstanding Balance
$116,715
Interest Rate
4.2%
Mortgage Type
New Conventional
Estimated Equity
$216,292
Purchase Details
Closed on
Jan 23, 2019
Sold by
Greyhawk Land Holdings Llc
Bought by
Nvr Inc and Ryan Homes
Purchase Details
Closed on
Feb 24, 2018
Sold by
Charles Morgan & Company Llc
Bought by
Greyhawk Land Holdings Llc
Purchase Details
Closed on
Jun 29, 2004
Sold by
Durham Ridge Investments Llc
Bought by
Charles Morgan & Co Llc
Home Financials for this Owner
Home Financials are based on the most recent Mortgage that was taken out on this home.
Original Mortgage
$290,000
Interest Rate
6.39%
Mortgage Type
Purchase Money Mortgage
Create a Home Valuation Report for This Property
The Home Valuation Report is an in-depth analysis detailing your home's value as well as a comparison with similar homes in the area
Home Values in the Area
Average Home Value in this Area
Purchase History
| Date | Buyer | Sale Price | Title Company |
|---|---|---|---|
| Weller M Lucille | $233,100 | Nvr Title Agency Llc | |
| Nvr Inc | $31,000 | Fidelity Natl Title Co Llc | |
| Greyhawk Land Holdings Llc | $26,000 | Fidelity National Title | |
| Charles Morgan & Co Llc | $290,000 | Revere Title Agency Inc |
Source: Public Records
Mortgage History
| Date | Status | Borrower | Loan Amount |
|---|---|---|---|
| Open | Weller M Lucille | $133,025 | |
| Previous Owner | Charles Morgan & Co Llc | $290,000 |
Source: Public Records
Tax History Compared to Growth
Tax History
| Year | Tax Paid | Tax Assessment Tax Assessment Total Assessment is a certain percentage of the fair market value that is determined by local assessors to be the total taxable value of land and additions on the property. | Land | Improvement |
|---|---|---|---|---|
| 2024 | $3,778 | $89,131 | $16,314 | $72,818 |
| 2023 | $4,691 | $92,439 | $18,099 | $74,340 |
| 2022 | $4,660 | $92,439 | $18,099 | $74,340 |
| 2021 | $4,662 | $92,439 | $18,099 | $74,340 |
| 2020 | $4,553 | $80,450 | $15,750 | $64,700 |
| 2019 | $506 | $8,820 | $8,820 | $0 |
| 2018 | $490 | $8,820 | $8,820 | $0 |
| 2017 | $292 | $4,920 | $4,920 | $0 |
| 2016 | $290 | $4,920 | $4,920 | $0 |
| 2015 | $290 | $4,920 | $4,920 | $0 |
| 2014 | $270 | $5,180 | $5,180 | $0 |
| 2013 | $262 | $5,180 | $5,180 | $0 |
Source: Public Records
Map
Nearby Homes
- 40725 Biggs Rd
- 829 Robinson Dr
- 831 Robinson Dr
- 822 Robinson Dr
- 808 Buckingham Dr
- 800 Buckingham Dr
- 756 N Center St
- 630 Rundle St
- 548 William St
- 607 Rundle St
- 516 Appomattox Ct
- 128 Harvest Ct
- 433 N Center St
- 171 Keywood Blvd
- 0 Dill Ct Unit 5072837
- 194 Railroad St
- 110 Railroad St
- 41635 Parsons Rd
- 40175 Banks Rd
- 40185 Banks Rd
- 812 Walcutt Ct
- 806 Walcutt Ct
- 808 Walcutt Ct
- 814 Walcutt Ct
- 804 Walcutt Ct
- 207 Granger Dr
- 803 Robinson Dr
- 801 Robinson Dr
- 802 Walcutt Ct
- 8814 Walcutt Ct
- 816 Walcutt Ct
- 819 Walcutt Ct
- 203 Granger Dr
- 807 Robinson Dr
- 818 Walcutt Ct
- 800 Walcutt Ct
- 811 Walcutt Ct
- 201 Granger Dr
- 809 Robinson Dr
- 809 Walcutt Ct