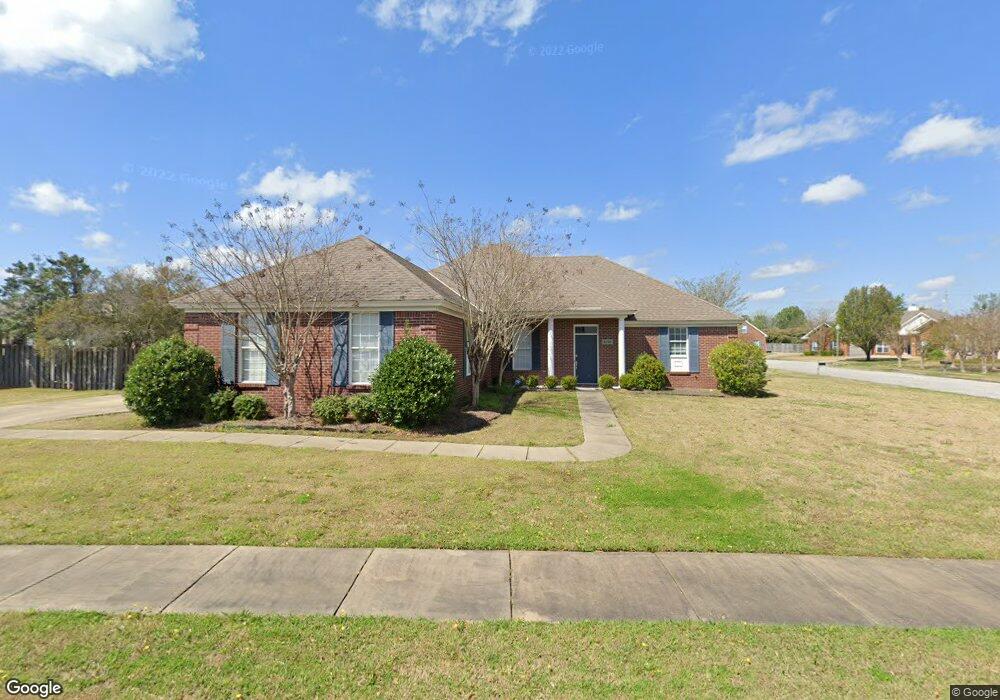
8100 Grayson Grove Montgomery, AL 36117
East Montgomery NeighborhoodEstimated Value: $275,779 - $297,000
3
Beds
2
Baths
1,869
Sq Ft
$152/Sq Ft
Est. Value
About This Home
This home is located at 8100 Grayson Grove, Montgomery, AL 36117 and is currently estimated at $284,195, approximately $152 per square foot. 8100 Grayson Grove is a home located in Montgomery County with nearby schools including Blount Elementary School, Johnnie R. Carr Middle School, and Park Crossing High School.
Ownership History
Date
Name
Owned For
Owner Type
Purchase Details
Closed on
Apr 20, 2018
Sold by
Grace Brandie V and Grace Jody L
Bought by
Vick Jeffery Kyle and Vick Chenoa Spring
Current Estimated Value
Home Financials for this Owner
Home Financials are based on the most recent Mortgage that was taken out on this home.
Original Mortgage
$146,800
Outstanding Balance
$126,304
Interest Rate
4.46%
Mortgage Type
New Conventional
Estimated Equity
$157,891
Purchase Details
Closed on
Aug 25, 2008
Sold by
Vick Chenoa Spring and Vick Jeffery K
Bought by
Grace Brandie and Grace Jody L
Home Financials for this Owner
Home Financials are based on the most recent Mortgage that was taken out on this home.
Original Mortgage
$198,777
Interest Rate
6.21%
Mortgage Type
FHA
Purchase Details
Closed on
Jan 31, 2001
Sold by
Lowder New Homes Inc
Bought by
Vick Jeffrey and Vick Chenoa Vick
Home Financials for this Owner
Home Financials are based on the most recent Mortgage that was taken out on this home.
Original Mortgage
$162,249
Interest Rate
7.18%
Create a Home Valuation Report for This Property
The Home Valuation Report is an in-depth analysis detailing your home's value as well as a comparison with similar homes in the area
Home Values in the Area
Average Home Value in this Area
Purchase History
| Date | Buyer | Sale Price | Title Company |
|---|---|---|---|
| Vick Jeffery Kyle | $183,500 | None Available | |
| Grace Brandie | $202,777 | None Available | |
| Vick Jeffrey | $167,749 | -- |
Source: Public Records
Mortgage History
| Date | Status | Borrower | Loan Amount |
|---|---|---|---|
| Open | Vick Jeffery Kyle | $146,800 | |
| Previous Owner | Grace Brandie | $198,777 | |
| Previous Owner | Vick Jeffrey | $162,249 |
Source: Public Records
Tax History Compared to Growth
Tax History
| Year | Tax Paid | Tax Assessment Tax Assessment Total Assessment is a certain percentage of the fair market value that is determined by local assessors to be the total taxable value of land and additions on the property. | Land | Improvement |
|---|---|---|---|---|
| 2025 | $2,495 | $51,260 | $8,000 | $43,260 |
| 2024 | $2,409 | $49,480 | $8,000 | $41,480 |
| 2023 | $2,409 | $48,700 | $8,000 | $40,700 |
| 2022 | $1,553 | $42,540 | $8,000 | $34,540 |
| 2021 | $1,432 | $39,220 | $8,000 | $31,220 |
| 2020 | $1,425 | $39,040 | $8,000 | $31,040 |
| 2019 | $1,396 | $38,240 | $8,000 | $30,240 |
| 2018 | $1,388 | $38,020 | $0 | $0 |
| 2017 | $1,381 | $37,840 | $8,000 | $29,840 |
| 2014 | $1,401 | $19,190 | $4,000 | $15,190 |
| 2013 | -- | $20,000 | $5,500 | $14,500 |
Source: Public Records
Map
Nearby Homes
- 8535 Melbourne Way
- 9283 Berrington Place
- 8513 Melbourne Cir
- 8465 Melbourne Cir
- 8908 Asheville Dr
- 8180 Longneedle Place
- 8731 Carillion Place
- 8661 Asheworth Dr
- 1220 Westfield Ln
- 9516 Wynlakes Place
- 8825 Templeton Ct
- 1154 Hallwood Ln
- 116 Payne Rd
- 8301 Wynlakes Blvd
- 1325 Hidden Ridge
- 1312 Hallwood Ln
- 8830 Old Magnolia Way
- 9831 Bent Brook Dr
- 1315 Richton Rd
- 1324 Cameron Ct
- 8352 Grayson Grove
- 8104 Grayson Grove
- 8340 Grayson Grove
- 8101 Grayson Grove
- 8365 Grayson Grove
- 8105 Grayson Grove
- 8336 Grayson Grove
- 8369 Grayson Grove
- 8108 Grayson Grove
- 8109 Grayson Grove
- 8377 Grayson Grove
- 8361 Grayson Grove
- 8332 Grayson Grove
- 8349 Grayson Grove
- 8116 Grayson Grove
- 8357 Grayson Grove
- 8341 Grayson Grove
- 8345 Grayson Grove
- 8117 Grayson Grove
- 8353 Grayson Grove