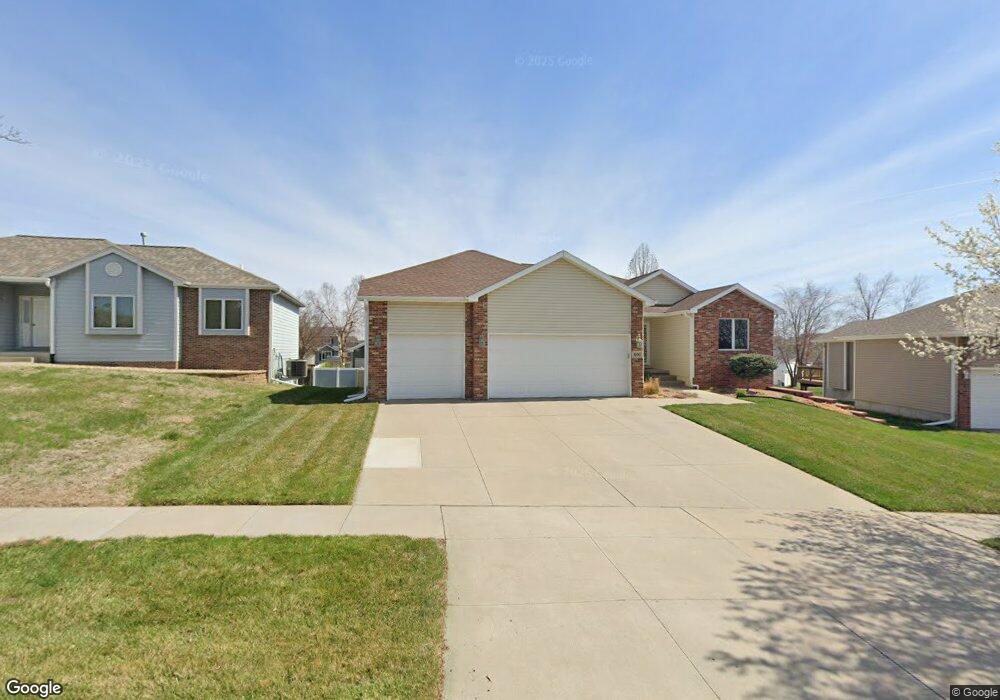
8100 S 33rd St Lincoln, NE 68516
Porter Ridge NeighborhoodEstimated Value: $441,000 - $482,000
4
Beds
3
Baths
4,680
Sq Ft
$98/Sq Ft
Est. Value
About This Home
This home is located at 8100 S 33rd St, Lincoln, NE 68516 and is currently estimated at $458,767, approximately $98 per square foot. 8100 S 33rd St is a home located in Lancaster County with nearby schools including Cavett Elementary School, Scott Middle School, and Southwest High School.
Ownership History
Date
Name
Owned For
Owner Type
Purchase Details
Closed on
Aug 18, 2004
Sold by
Albin Timothy L and Albin Brooke K
Bought by
Retzlaff Stephen C and Retzlaff Catharine M
Current Estimated Value
Home Financials for this Owner
Home Financials are based on the most recent Mortgage that was taken out on this home.
Original Mortgage
$208,800
Outstanding Balance
$103,541
Interest Rate
6%
Mortgage Type
Unknown
Estimated Equity
$355,226
Purchase Details
Closed on
May 30, 2003
Sold by
Mcgill & Wulf Construction Inc
Bought by
Albin Timothy L
Home Financials for this Owner
Home Financials are based on the most recent Mortgage that was taken out on this home.
Original Mortgage
$200,800
Interest Rate
5.79%
Mortgage Type
Unknown
Purchase Details
Closed on
Jan 14, 2003
Sold by
Prairie Homes Builders Inc
Bought by
Mcgill & Wulf Construction Inc
Purchase Details
Closed on
Dec 2, 2002
Sold by
Ridge Development Company
Bought by
Prairie Homes Builders Inc
Create a Home Valuation Report for This Property
The Home Valuation Report is an in-depth analysis detailing your home's value as well as a comparison with similar homes in the area
Home Values in the Area
Average Home Value in this Area
Purchase History
| Date | Buyer | Sale Price | Title Company |
|---|---|---|---|
| Retzlaff Stephen C | $261,000 | -- | |
| Albin Timothy L | $252,000 | -- | |
| Mcgill & Wulf Construction Inc | $39,000 | -- | |
| Prairie Homes Builders Inc | $39,000 | -- |
Source: Public Records
Mortgage History
| Date | Status | Borrower | Loan Amount |
|---|---|---|---|
| Open | Retzlaff Stephen C | $208,800 | |
| Closed | Albin Timothy L | $200,800 | |
| Closed | Albin Timothy L | $25,100 |
Source: Public Records
Tax History Compared to Growth
Tax History
| Year | Tax Paid | Tax Assessment Tax Assessment Total Assessment is a certain percentage of the fair market value that is determined by local assessors to be the total taxable value of land and additions on the property. | Land | Improvement |
|---|---|---|---|---|
| 2025 | $5,725 | $447,900 | $80,500 | $367,400 |
| 2024 | $5,725 | $410,400 | $80,500 | $329,900 |
| 2023 | $6,540 | $390,200 | $80,500 | $309,700 |
| 2022 | $6,900 | $346,200 | $55,000 | $291,200 |
| 2021 | $6,527 | $346,200 | $55,000 | $291,200 |
| 2020 | $5,943 | $311,000 | $55,000 | $256,000 |
| 2019 | $5,943 | $311,000 | $55,000 | $256,000 |
| 2018 | $5,916 | $308,200 | $55,000 | $253,200 |
| 2017 | $5,970 | $308,200 | $55,000 | $253,200 |
| 2016 | $5,022 | $257,900 | $45,000 | $212,900 |
| 2015 | $4,987 | $257,900 | $45,000 | $212,900 |
| 2014 | $4,658 | $239,500 | $52,000 | $187,500 |
| 2013 | -- | $239,500 | $52,000 | $187,500 |
Source: Public Records
Map
Nearby Homes
- 8100 McKinty Ln
- 3508 Mclaughlin Dr
- 3543 Mclaughlin Dr
- 8446 S Tularosa Ct
- 7740 O'Rourke Dr
- 8025 Palmilla Ln
- 8005 Laytonjohn Ln
- 7566 S 32nd St
- 3701 Diablo Dr
- 7656 S 37th St
- 10235 S 33rd St
- 10310 S 33rd St
- 10301 S 33rd St
- 10323 S 33rd St
- 10225 S 33rd St
- 8720 S 38th St
- 3734 Broadbear Rd
- 7355 S 30th St
- 7820 S 26th St
- 3615 Wilderness Hills Blvd
- 8040 S 33rd St
- 8108 S 33rd St
- 8111 S 34th St
- 8121 S 34th St
- 8101 S 34th St
- 8030 S 33rd St
- 8118 S 33rd St
- 8101 S 33rd St
- 8033 S 34th St
- 8035 S 33rd St
- 3330 Grainger Pkwy
- 8020 S 33rd St
- 3340 Grainger Pkwy
- 8111 S 33rd St
- 8130 S 33rd St
- 8025 S 33rd St
- 3320 Grainger Pkwy
- 8025 S 34th St
- 8121 S 33rd St
- 8010 S 33rd St