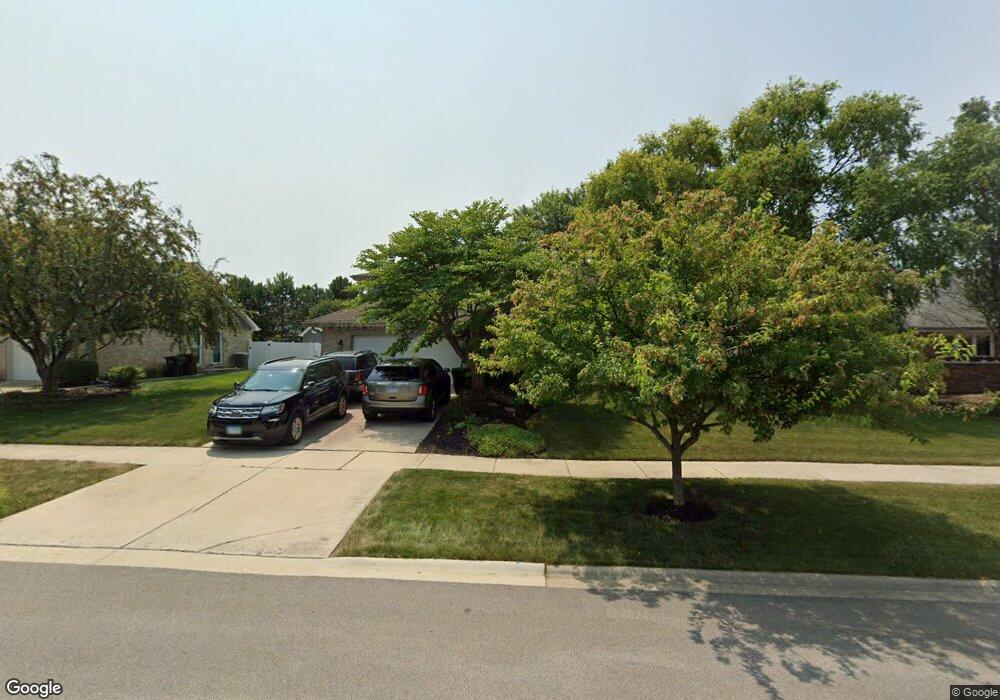
8101 174th Place Tinley Park, IL 60477
Central Tinley Park NeighborhoodEstimated Value: $466,000 - $505,000
3
Beds
3
Baths
2,700
Sq Ft
$179/Sq Ft
Est. Value
About This Home
This home is located at 8101 174th Place, Tinley Park, IL 60477 and is currently estimated at $482,972, approximately $178 per square foot. 8101 174th Place is a home located in Cook County with nearby schools including Millennium Elementary School, Virgil I Grissom Middle School, and Victor J Andrew High School.
Ownership History
Date
Name
Owned For
Owner Type
Purchase Details
Closed on
Jun 30, 2017
Sold by
Perich Robert P and Perich Patricia A
Bought by
Sunke Annette B
Current Estimated Value
Home Financials for this Owner
Home Financials are based on the most recent Mortgage that was taken out on this home.
Original Mortgage
$305,425
Outstanding Balance
$256,229
Interest Rate
4.25%
Mortgage Type
New Conventional
Estimated Equity
$226,743
Purchase Details
Closed on
Sep 2, 2015
Sold by
Standard Bank & Trust Company
Bought by
Perich Robert P and Perich Patricia A
Home Financials for this Owner
Home Financials are based on the most recent Mortgage that was taken out on this home.
Original Mortgage
$124,450
Interest Rate
4.25%
Mortgage Type
New Conventional
Purchase Details
Closed on
Mar 26, 2004
Sold by
Perich Robert and Perich Patricia
Bought by
Standard Bank & Trust Co and Trust #18175
Create a Home Valuation Report for This Property
The Home Valuation Report is an in-depth analysis detailing your home's value as well as a comparison with similar homes in the area
Home Values in the Area
Average Home Value in this Area
Purchase History
| Date | Buyer | Sale Price | Title Company |
|---|---|---|---|
| Sunke Annette B | $321,500 | Fidelity National Title | |
| Perich Robert P | -- | Timios Inc | |
| Standard Bank & Trust Co | -- | -- |
Source: Public Records
Mortgage History
| Date | Status | Borrower | Loan Amount |
|---|---|---|---|
| Open | Sunke Annette B | $305,425 | |
| Previous Owner | Perich Robert P | $124,450 |
Source: Public Records
Tax History Compared to Growth
Tax History
| Year | Tax Paid | Tax Assessment Tax Assessment Total Assessment is a certain percentage of the fair market value that is determined by local assessors to be the total taxable value of land and additions on the property. | Land | Improvement |
|---|---|---|---|---|
| 2024 | $9,630 | $38,000 | $6,750 | $31,250 |
| 2023 | $9,466 | $38,000 | $6,750 | $31,250 |
| 2022 | $9,466 | $29,973 | $5,906 | $24,067 |
| 2021 | $9,193 | $29,973 | $5,906 | $24,067 |
| 2020 | $9,030 | $29,973 | $5,906 | $24,067 |
| 2019 | $8,239 | $28,833 | $5,343 | $23,490 |
| 2018 | $8,061 | $28,833 | $5,343 | $23,490 |
| 2017 | $10,617 | $34,368 | $5,343 | $29,025 |
| 2016 | $7,247 | $26,100 | $4,781 | $21,319 |
| 2015 | $8,845 | $29,543 | $4,781 | $24,762 |
| 2014 | $8,787 | $29,543 | $4,781 | $24,762 |
| 2013 | $7,933 | $28,898 | $4,781 | $24,117 |
Source: Public Records
Map
Nearby Homes
- 7925 Belle Rive Ct
- 17800 Iroquois Trace
- 17116 Dooneen Ave
- 7841 Bristol Park Dr
- 17908 Iroquois Trace
- 8444 W 171st St
- 8229 170th St Unit 8229
- 17155 Kamp Ct Unit 9
- 7727 Bristol Park Dr
- 8543 Carriage Ln
- 7783 Bristol Park Dr Unit 1-SW
- 17121 Ozark Ave
- 8530 Radcliffe Rd
- Eden Plan at Radcliffe Place
- Fremont Plan at Radcliffe Place
- Danbury Plan at Radcliffe Place
- Calysta Plan at Radcliffe Place
- Briarcliffe Plan at Radcliffe Place
- Amberwood Plan at Radcliffe Place
- 8456 170th Place
- 8109 174th Place
- 8031 174th Place
- 8117 174th Place
- 8102 174th Place
- 8036 174th Place
- 8110 174th Place
- 8030 174th Place
- 8025 174th Place
- 8118 174th Place
- 8125 174th Place
- 8045 174th St
- 8103 174th St
- 8050 Iroquois Trace
- 8103 174th St
- 8039 174th St
- 8126 174th Place
- 8026 174th Place
- 8019 174th Place
- 8040 Iroquois Trace
- 8070 Iroquois Trace