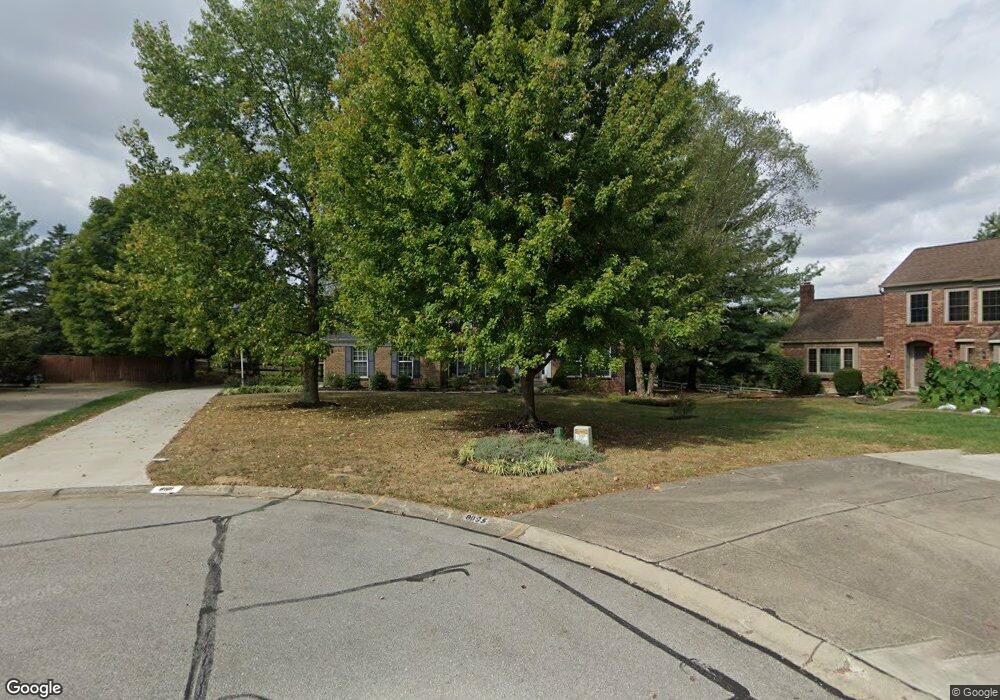
8101 Misty Lake Dr Florence, KY 41042
Estimated Value: $408,000 - $435,000
4
Beds
3
Baths
2,500
Sq Ft
$168/Sq Ft
Est. Value
About This Home
This home is located at 8101 Misty Lake Dr, Florence, KY 41042 and is currently estimated at $419,266, approximately $167 per square foot. 8101 Misty Lake Dr is a home located in Boone County with nearby schools including A.M. Yealey Elementary School, Ockerman Middle School, and Boone County High School.
Ownership History
Date
Name
Owned For
Owner Type
Purchase Details
Closed on
Aug 2, 2017
Sold by
Ingraham Richard L
Bought by
Ingraham Richard L and Ingraham Quella Jh
Current Estimated Value
Purchase Details
Closed on
Feb 4, 2013
Sold by
Ingraham Richard L and Askins Elizabeth A
Bought by
Ingraham Richard L
Home Financials for this Owner
Home Financials are based on the most recent Mortgage that was taken out on this home.
Original Mortgage
$205,200
Outstanding Balance
$143,380
Interest Rate
3.4%
Mortgage Type
Future Advance Clause Open End Mortgage
Estimated Equity
$275,886
Purchase Details
Closed on
Jul 3, 1997
Sold by
London Mark A
Bought by
Ingraham Richard L and Ingraham Elizabeth A
Home Financials for this Owner
Home Financials are based on the most recent Mortgage that was taken out on this home.
Original Mortgage
$135,000
Interest Rate
7.92%
Mortgage Type
Balloon
Purchase Details
Closed on
Aug 10, 1995
Sold by
Deatherage Betty R
Bought by
Kenton County Airport Board
Create a Home Valuation Report for This Property
The Home Valuation Report is an in-depth analysis detailing your home's value as well as a comparison with similar homes in the area
Home Values in the Area
Average Home Value in this Area
Purchase History
| Date | Buyer | Sale Price | Title Company |
|---|---|---|---|
| Ingraham Richard L | -- | None Available | |
| Ingraham Richard L | -- | Springdale Title Llc | |
| Ingraham Richard L | $186,000 | -- | |
| Kenton County Airport Board | $58,000 | -- |
Source: Public Records
Mortgage History
| Date | Status | Borrower | Loan Amount |
|---|---|---|---|
| Open | Ingraham Richard L | $205,200 | |
| Closed | Ingraham Richard L | $135,000 |
Source: Public Records
Tax History Compared to Growth
Tax History
| Year | Tax Paid | Tax Assessment Tax Assessment Total Assessment is a certain percentage of the fair market value that is determined by local assessors to be the total taxable value of land and additions on the property. | Land | Improvement |
|---|---|---|---|---|
| 2024 | $2,635 | $279,400 | $40,000 | $239,400 |
| 2023 | $2,727 | $279,400 | $40,000 | $239,400 |
| 2022 | $2,892 | $257,600 | $40,000 | $217,600 |
| 2021 | $2,973 | $257,600 | $40,000 | $217,600 |
| 2020 | $2,519 | $220,000 | $40,000 | $180,000 |
| 2019 | $2,548 | $220,000 | $40,000 | $180,000 |
| 2018 | $2,471 | $210,000 | $38,000 | $172,000 |
| 2017 | $2,396 | $210,000 | $38,000 | $172,000 |
| 2015 | $2,367 | $210,000 | $38,000 | $172,000 |
| 2013 | -- | $210,000 | $38,000 | $172,000 |
Source: Public Records
Map
Nearby Homes
- 8163 Woodcreek Dr Unit 309
- 7603 Thunder Ridge Dr
- 8253 Heatherwood Dr
- 8724 Sentry Dr
- 2263 Forest Lawn Dr
- 2318 Summerset Cir
- 2205 Antoinette Way
- 8388 Woodcreek Dr
- 1882 Mountainview Ct
- 7497 Harvesthome Dr
- 8869 Sentry Dr
- 2159 Algiers St
- 2150 Antoinette Way
- 2350 Antoinette Way
- 7142 Highpoint Dr
- 9127 Timberbrook Ln Unit A
- 7607 Cloudstone Dr
- 7345 Centrecrest Ln Unit A
- 8629 Treeline Dr
- 2238 Algiers St
- 8107 Misty Lake Dr
- 8095 Misty Lake Dr
- 8076 Trailwood Ct
- 8068 Trailwood Ct
- 8113 Misty Lake Dr
- 8096 Misty Lake Dr
- 8082 Trailwood Ct
- 8102 Misty Lake Dr
- 8042 Trailwood Ct
- 8088 Trailwood Ct
- 8108 Misty Lake Dr
- 8119 Misty Lake Dr
- 8036 Trailwood Ct
- 8094 Trailwood Ct
- 8114 Misty Lake Dr
- 8113 Woodcreek Dr
- 7839 Pleasant Valley Rd
- 8075 Trailwood Ct
- 8081 Trailwood Ct
- 8063 Trailwood Ct