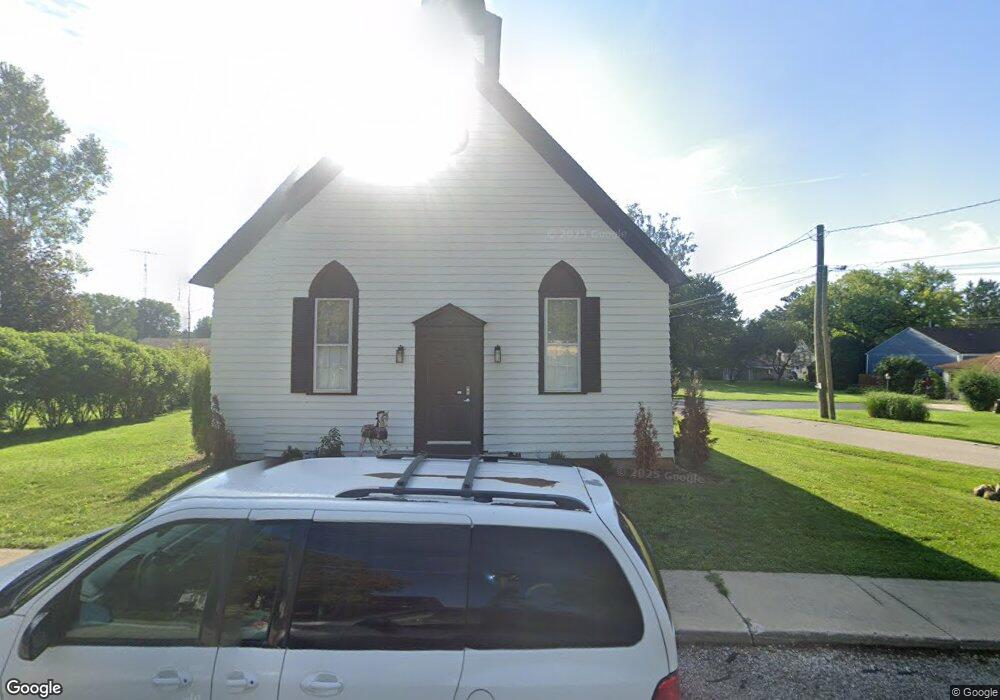
8102 Blivin St Spring Grove, IL 60081
Estimated Value: $203,908 - $284,000
Studio
--
Bath
1,106
Sq Ft
$210/Sq Ft
Est. Value
About This Home
This home is located at 8102 Blivin St, Spring Grove, IL 60081 and is currently estimated at $231,977, approximately $209 per square foot. 8102 Blivin St is a home located in McHenry County with nearby schools including Spring Grove Elementary School, Nippersink Middle School, and Richmond-Burton High School.
Ownership History
Date
Name
Owned For
Owner Type
Purchase Details
Closed on
Jul 26, 2023
Sold by
Tbl Investements Llc and Mber Properties Llc
Bought by
Cbg Properties Llc
Current Estimated Value
Purchase Details
Closed on
Jan 28, 2020
Sold by
Mber Properties Llc
Bought by
Tbl Investmetns Llc
Purchase Details
Closed on
Oct 11, 2019
Sold by
Home State Bank Na
Bought by
Mber Properties Llc
Home Financials for this Owner
Home Financials are based on the most recent Mortgage that was taken out on this home.
Original Mortgage
$66,000
Interest Rate
3.5%
Mortgage Type
Commercial
Purchase Details
Closed on
Apr 7, 2011
Sold by
Home State Bank/National Association
Bought by
Home State Bank/National Association and Trust #5917
Purchase Details
Closed on
Jun 8, 2009
Sold by
First Midwest Bank
Bought by
Home State Bank and Trust #5789
Purchase Details
Closed on
Jan 28, 2008
Sold by
First Midwest Bank
Bought by
First Midwest Bank and Trust #13285
Create a Home Valuation Report for This Property
The Home Valuation Report is an in-depth analysis detailing your home's value as well as a comparison with similar homes in the area
Home Values in the Area
Average Home Value in this Area
Purchase History
| Date | Buyer | Sale Price | Title Company |
|---|---|---|---|
| Cbg Properties Llc | $160,000 | None Listed On Document | |
| Tbl Investmetns Llc | -- | Attorney | |
| Mber Properties Llc | $88,000 | Fidelity National Title | |
| Home State Bank/National Association | -- | None Available | |
| Home State Bank | -- | None Available | |
| First Midwest Bank | -- | Ticor |
Source: Public Records
Mortgage History
| Date | Status | Borrower | Loan Amount |
|---|---|---|---|
| Previous Owner | Mber Properties Llc | $66,000 |
Source: Public Records
Tax History
| Year | Tax Paid | Tax Assessment Tax Assessment Total Assessment is a certain percentage of the fair market value that is determined by local assessors to be the total taxable value of land and additions on the property. | Land | Improvement |
|---|---|---|---|---|
| 2024 | $2,046 | $27,245 | $10,534 | $16,711 |
| 2023 | $2,042 | $25,411 | $9,825 | $15,586 |
| 2022 | $1,903 | $22,353 | $8,643 | $13,710 |
| 2021 | $1,815 | $21,072 | $8,148 | $12,924 |
| 2020 | $1,779 | $20,143 | $7,789 | $12,354 |
| 2019 | $1,793 | $19,830 | $7,668 | $12,162 |
| 2018 | $1,833 | $19,217 | $7,431 | $11,786 |
| 2017 | $1,815 | $18,046 | $6,978 | $11,068 |
| 2016 | $1,829 | $17,234 | $6,664 | $10,570 |
| 2013 | -- | $15,678 | $4,410 | $11,268 |
Source: Public Records
Map
Nearby Homes
- 2214 Main Street Rd
- Lot 65,66,&64 Main Street Rd
- LOT 9 Mayo Ct
- 1992 Red Oak Ln
- 1876 Red Oak Ln
- Lot 56 & 57 Beverly Way
- Lot 58 & 59 Beverly Way
- Lot 60 & 61 Beverly Way
- 8207 Squirrel Dr
- Lot 36 Red Oak Ln
- 2003 Red Oak Ln
- 1979 Red Oak Ln
- 1975 Red Oak Ln
- 7393 English Oak Ln
- 2150 U S 12
- 7388 English Oak Ln
- 1852 Red Oak Ln
- 7389 English Oak Ln
- 1971 Red Oak Ln
- 1848 Red Oak Ln
- 8104 Blivin St
- 8020 Blivin St
- 1912 North St
- 8101 Blivin St
- 8016 Blivin St
- 8103 Blivin St
- 1924 Main Street Rd
- 1922 Main Street Rd
- 8021 Blivin St
- 1928 Main Street Rd
- 1928 Main Street Rd
- 1920 Main Street Rd
- 1918 Main Street Rd
- 2008 Main Street Rd
- 8013 East St
- 2010 Main Street Rd
- 1914 Main Street Rd
- 1923 Main Street Rd
- 1921 Main Street Rd
- 1912 Main Street Rd
Your Personal Tour Guide
Ask me questions while you tour the home.