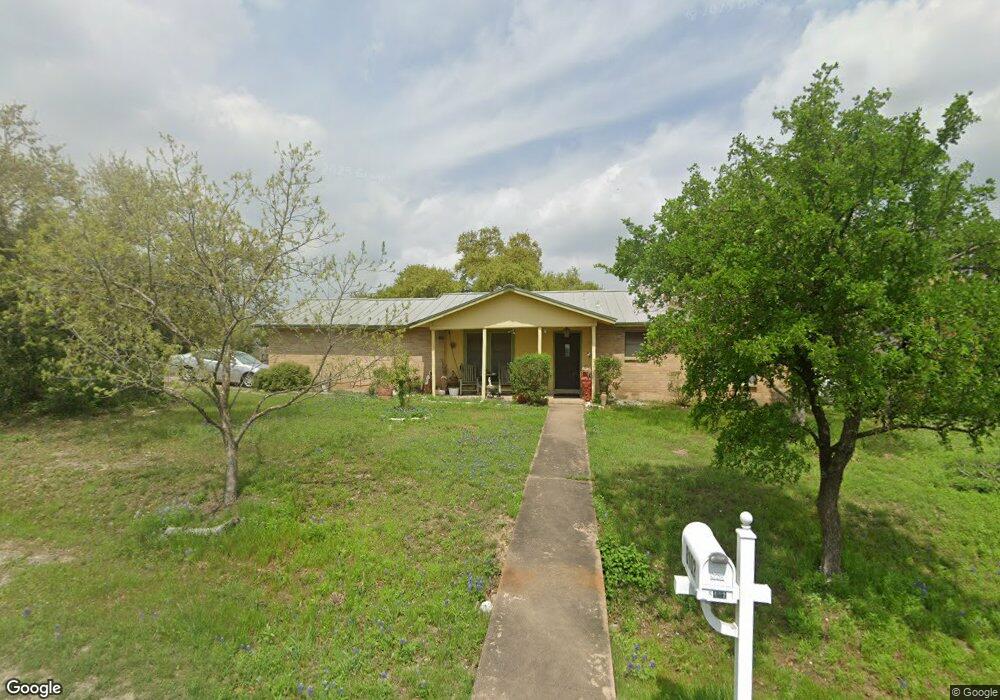
8102 Little Deer Crossing Austin, TX 78736
West Oak Hill NeighborhoodEstimated Value: $406,293 - $482,000
--
Bed
2
Baths
1,204
Sq Ft
$376/Sq Ft
Est. Value
About This Home
This home is located at 8102 Little Deer Crossing, Austin, TX 78736 and is currently estimated at $452,323, approximately $375 per square foot. 8102 Little Deer Crossing is a home located in Travis County with nearby schools including Patton Elementary School, Small Middle School, and James Bowie High School.
Ownership History
Date
Name
Owned For
Owner Type
Purchase Details
Closed on
Jun 27, 2025
Sold by
Heiser David Christopher
Bought by
David Christopher Heiser Revocable Trust and Heiser
Current Estimated Value
Purchase Details
Closed on
Jul 2, 1996
Sold by
Entler John A
Bought by
Heiser David Christopher
Home Financials for this Owner
Home Financials are based on the most recent Mortgage that was taken out on this home.
Original Mortgage
$67,900
Interest Rate
8.02%
Mortgage Type
Purchase Money Mortgage
Purchase Details
Closed on
Jan 4, 1994
Sold by
Neans Glenn and Cochran Frank
Bought by
Vinson Stephen A and Vinson Sandra S
Home Financials for this Owner
Home Financials are based on the most recent Mortgage that was taken out on this home.
Original Mortgage
$74,460
Interest Rate
7.23%
Mortgage Type
Assumption
Create a Home Valuation Report for This Property
The Home Valuation Report is an in-depth analysis detailing your home's value as well as a comparison with similar homes in the area
Home Values in the Area
Average Home Value in this Area
Purchase History
| Date | Buyer | Sale Price | Title Company |
|---|---|---|---|
| David Christopher Heiser Revocable Trust | -- | None Listed On Document | |
| Heiser David Christopher | -- | -- | |
| Vinson Stephen A | -- | Title Agency Of Austin | |
| Entler John A | -- | Title Agency Of Austin |
Source: Public Records
Mortgage History
| Date | Status | Borrower | Loan Amount |
|---|---|---|---|
| Previous Owner | Heiser David Christopher | $67,900 | |
| Previous Owner | Entler John A | $74,460 |
Source: Public Records
Tax History Compared to Growth
Tax History
| Year | Tax Paid | Tax Assessment Tax Assessment Total Assessment is a certain percentage of the fair market value that is determined by local assessors to be the total taxable value of land and additions on the property. | Land | Improvement |
|---|---|---|---|---|
| 2025 | $4,439 | $421,157 | $221,083 | $200,074 |
| 2023 | $4,439 | $376,529 | $0 | $0 |
| 2022 | $6,760 | $342,299 | $0 | $0 |
| 2021 | $6,773 | $311,181 | $120,000 | $196,970 |
| 2020 | $6,068 | $282,892 | $120,000 | $162,892 |
| 2018 | $5,555 | $250,889 | $120,000 | $149,684 |
| 2017 | $5,087 | $228,081 | $80,000 | $148,578 |
| 2016 | $4,624 | $207,346 | $80,000 | $148,578 |
| 2015 | $3,690 | $188,496 | $40,000 | $160,537 |
| 2014 | $3,690 | $171,360 | $0 | $0 |
Source: Public Records
Map
Nearby Homes
- 7008 Chinook Dr
- 7010 Harvest Trail Dr
- 8005 Red Willow Dr
- Plan 2070 at Creekside at Estancia
- Plan 2245 at Creekside at Estancia
- Plan 1888 at Scenic Pass
- Plan 2881 at Scenic Pass
- Plan 1675 at Scenic Pass
- Plan 2586 at Creekside at Estancia
- Plan 1908 Modeled at Creekside at Estancia
- Plan 2469 at Scenic Pass
- Plan 2527 Modeled at Creekside at Estancia
- Plan 2502 at Scenic Pass
- Plan 1315 at Creekside at Estancia
- Plan 1548 at Creekside at Estancia
- Plan 1780 at Creekside at Estancia
- Plan 1491 at Scenic Pass
- Plan 2509 at Creekside at Estancia
- Plan 2458 at Creekside at Estancia
- Plan 1360 Modeled at Creekside at Estancia
- 8104 Mescalero Dr
- 8104 Mescalero Dr Unit A
- 8100 Little Deer Crossing
- 7011 Moccasin Path
- 8101 Mescalero Dr
- 6916 Rifle Bend
- 8101 Little Deer Crossing
- 8103 Little Deer Crossing
- 8106 Mescalero Dr Unit A
- 8106 Mescalero Dr
- 6903 Chinook Dr
- 8105 Mescalero Dr
- 8105 Little Deer Crossing
- 8200 Mescalero Dr Unit B
- 8200 Mescalero Dr Unit A
- 8200 Mescalero Dr
- 6914 Rifle Bend Unit A&B
- 6914 Rifle Bend Unit B
- 6914 Rifle Bend Unit A
- 8010 Little Deer Crossing