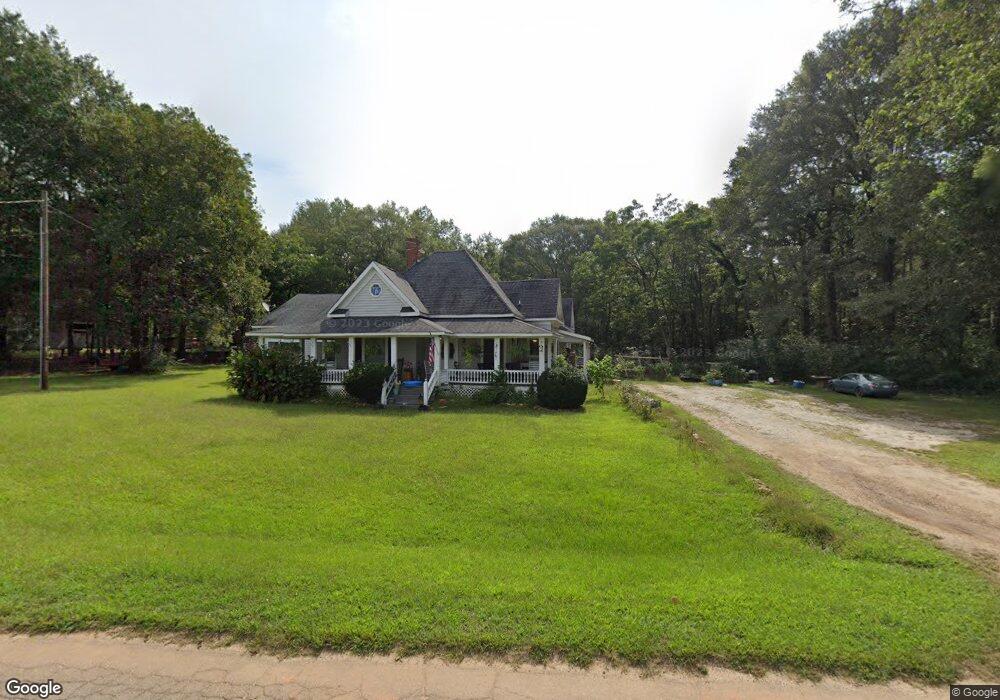
8102 Rocky Mount Rd Luthersville, GA 30251
Estimated Value: $301,477 - $402,000
3
Beds
3
Baths
2,788
Sq Ft
$123/Sq Ft
Est. Value
About This Home
This home is located at 8102 Rocky Mount Rd, Luthersville, GA 30251 and is currently estimated at $342,119, approximately $122 per square foot. 8102 Rocky Mount Rd is a home located in Meriwether County with nearby schools including Unity Elementary School.
Ownership History
Date
Name
Owned For
Owner Type
Purchase Details
Closed on
Jul 12, 2011
Sold by
Secretary Of Housing
Bought by
Murphy James A
Current Estimated Value
Purchase Details
Closed on
Jun 22, 2011
Sold by
Secretary Of Housing
Bought by
Murphy James A
Purchase Details
Closed on
Jan 24, 2011
Sold by
Chase Home Finance Llc
Bought by
Secretary Of Housing
Purchase Details
Closed on
Jan 4, 2011
Sold by
Kneuer Edward G
Bought by
Chase Home Finance Llc
Purchase Details
Closed on
Feb 8, 2008
Sold by
Brown Thomas
Bought by
Brown Thomas R and Brown Eugenia G
Home Financials for this Owner
Home Financials are based on the most recent Mortgage that was taken out on this home.
Original Mortgage
$213,150
Interest Rate
5.85%
Mortgage Type
New Conventional
Purchase Details
Closed on
Jun 1, 1995
Sold by
Farmers & Mer Bank
Bought by
Mills John
Purchase Details
Closed on
May 1, 1989
Bought by
Farmers & Mer Bank
Create a Home Valuation Report for This Property
The Home Valuation Report is an in-depth analysis detailing your home's value as well as a comparison with similar homes in the area
Home Values in the Area
Average Home Value in this Area
Purchase History
| Date | Buyer | Sale Price | Title Company |
|---|---|---|---|
| Murphy James A | $125,000 | -- | |
| Murphy James A | $125,000 | -- | |
| Secretary Of Housing | -- | -- | |
| Secretary Of Housing | -- | -- | |
| Chase Home Finance Llc | -- | -- | |
| Chase Home Finance Llc | -- | -- | |
| Brown Thomas R | -- | -- | |
| Mills John | -- | -- | |
| Farmers & Mer Bank | $110,000 | -- |
Source: Public Records
Mortgage History
| Date | Status | Borrower | Loan Amount |
|---|---|---|---|
| Previous Owner | Brown Thomas R | $213,150 |
Source: Public Records
Tax History Compared to Growth
Tax History
| Year | Tax Paid | Tax Assessment Tax Assessment Total Assessment is a certain percentage of the fair market value that is determined by local assessors to be the total taxable value of land and additions on the property. | Land | Improvement |
|---|---|---|---|---|
| 2024 | $1,652 | $83,880 | $9,360 | $74,520 |
| 2023 | $1,638 | $57,440 | $9,360 | $48,080 |
| 2022 | $1,638 | $57,440 | $9,360 | $48,080 |
| 2021 | $1,664 | $57,440 | $9,360 | $48,080 |
| 2020 | $1,677 | $57,440 | $9,360 | $48,080 |
| 2019 | $1,664 | $57,440 | $9,360 | $48,080 |
| 2018 | $1,698 | $57,440 | $9,360 | $48,080 |
| 2017 | $1,681 | $48,240 | $9,360 | $38,880 |
| 2016 | $1,524 | $48,240 | $9,360 | $38,880 |
| 2015 | $1,526 | $48,240 | $9,360 | $38,880 |
| 2014 | $1,526 | $48,240 | $9,360 | $38,880 |
| 2013 | -- | $48,240 | $9,360 | $38,880 |
Source: Public Records
Map
Nearby Homes
- 0 Rocky Mount Rd Unit 10592451
- 0 Bethel Church Rd Unit 221403
- 6536 Luthersville Rd
- 19 ACRES 6536 Luthersville Rd Unit 19 ACRES
- 759 Alvaton Rd
- 6288 Rocky Mount Rd Unit 2
- 6348 Rocky Mount Rd Unit 3
- 711 Hunter Welch Pkwy
- 1606 McWilliams Barber Rd
- 882 Caldwell Rd
- 285 R L Parker Dr
- 629 Hunter Welch Pkwy
- 5529 Rocky Mount Rd
- 2046 McWilliams Barber Rd
- 1256 Coleman Creek Cir
- 1419 Hunter Welch Pkwy
- 1086 Hunter Welch Pkwy
- 12 Parker Ct
- 1888 Hunter Welch Pkwy
- 234 R L Parker Dr
- 8059 Rocky Mount Rd
- 8162 Rocky Mount Rd
- 8014 Rocky Mount Rd
- 7959 Rocky Mount Rd
- 7960 Rocky Mount Rd
- 5353 Luthersville Rd
- 5321 Luthersville Rd
- 7892 Rocky Mount Rd
- 8330 Rocky Mount Rd
- 5269 Luthersville Rd
- 5266 Luthersville Rd
- LOT 3 Rocky Mount Rd
- LOT 10 Rocky Mount Rd
- LOT 9 Rocky Mount Rd
- LOT 8 Rocky Mount Rd
- LOT 7 Rocky Mount Rd
- LOT 6 Rocky Mount Rd
- LOT 5 Rocky Mount Rd
- 10445 Rocky Mount Rd
- 5144 Luthersville Rd