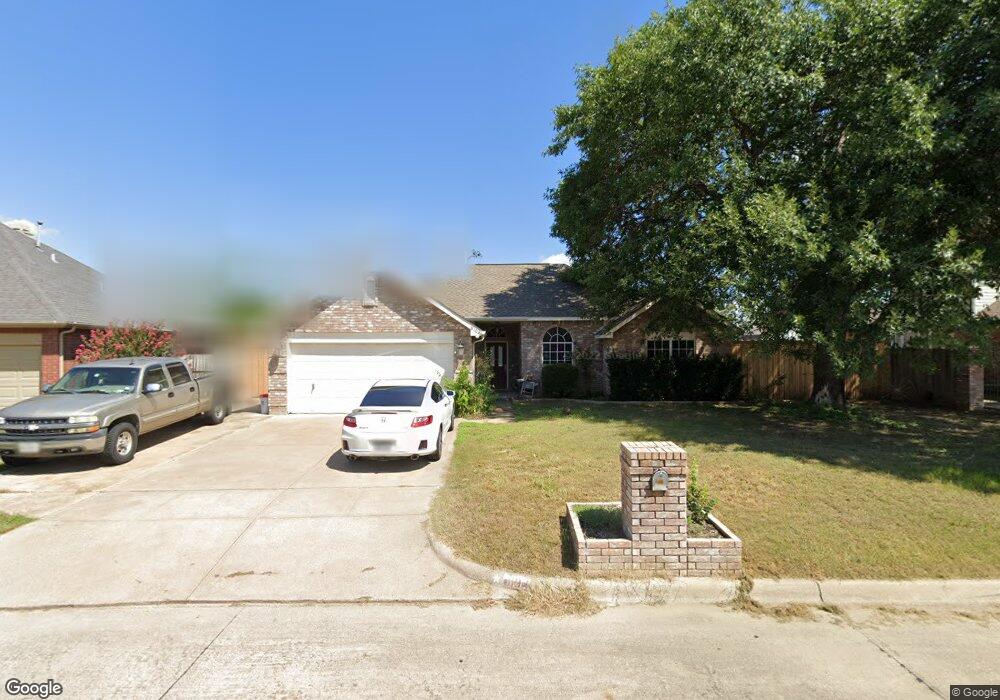
8104 Autumn Run Ln North Richland Hills, TX 76182
Estimated Value: $374,441 - $420,000
3
Beds
2
Baths
1,781
Sq Ft
$221/Sq Ft
Est. Value
About This Home
This home is located at 8104 Autumn Run Ln, North Richland Hills, TX 76182 and is currently estimated at $393,360, approximately $220 per square foot. 8104 Autumn Run Ln is a home located in Tarrant County with nearby schools including Green Valley Elementary School, North Ridge Middle School, and Richland High School.
Ownership History
Date
Name
Owned For
Owner Type
Purchase Details
Closed on
Mar 23, 2024
Sold by
Nicholas Donna L
Bought by
Nicholas Richard H
Current Estimated Value
Purchase Details
Closed on
Apr 19, 2000
Sold by
Walraven Darrin V
Bought by
Nicholas Richard H and Nicholas Donna L
Home Financials for this Owner
Home Financials are based on the most recent Mortgage that was taken out on this home.
Original Mortgage
$112,076
Interest Rate
8.24%
Mortgage Type
FHA
Purchase Details
Closed on
Apr 24, 1998
Sold by
Walraven Raye Ann
Bought by
Walraven Darren Vaughan
Purchase Details
Closed on
Nov 21, 1997
Sold by
Rutherford David Brent and Rutherford Tonya Kay
Bought by
Walraven Darrin and Walraven Raye Ann
Home Financials for this Owner
Home Financials are based on the most recent Mortgage that was taken out on this home.
Original Mortgage
$102,600
Interest Rate
7.23%
Create a Home Valuation Report for This Property
The Home Valuation Report is an in-depth analysis detailing your home's value as well as a comparison with similar homes in the area
Home Values in the Area
Average Home Value in this Area
Purchase History
| Date | Buyer | Sale Price | Title Company |
|---|---|---|---|
| Nicholas Richard H | -- | None Listed On Document | |
| Nicholas Richard H | -- | American Title Co | |
| Walraven Darren Vaughan | -- | -- | |
| Walraven Darrin | -- | Stewart Title |
Source: Public Records
Mortgage History
| Date | Status | Borrower | Loan Amount |
|---|---|---|---|
| Previous Owner | Nicholas Richard H | $112,076 | |
| Previous Owner | Walraven Darrin | $102,600 |
Source: Public Records
Tax History Compared to Growth
Tax History
| Year | Tax Paid | Tax Assessment Tax Assessment Total Assessment is a certain percentage of the fair market value that is determined by local assessors to be the total taxable value of land and additions on the property. | Land | Improvement |
|---|---|---|---|---|
| 2025 | $6,112 | $366,149 | $75,000 | $291,149 |
| 2024 | $6,112 | $366,149 | $75,000 | $291,149 |
| 2023 | $7,322 | $368,460 | $75,000 | $293,460 |
| 2022 | $7,301 | $317,567 | $45,000 | $272,567 |
| 2021 | $7,019 | $299,776 | $45,000 | $254,776 |
| 2020 | $6,381 | $265,965 | $45,000 | $220,965 |
| 2019 | $6,003 | $267,664 | $45,000 | $222,664 |
| 2018 | $4,912 | $207,237 | $45,000 | $162,237 |
| 2017 | $5,069 | $233,293 | $45,000 | $188,293 |
| 2016 | $4,608 | $198,886 | $35,000 | $163,886 |
| 2015 | $3,825 | $155,700 | $20,000 | $135,700 |
| 2014 | $3,825 | $155,700 | $20,000 | $135,700 |
Source: Public Records
Map
Nearby Homes
- 7924 Ember Oaks Dr
- 7924 Woodland Dr
- 7901 Forest Point Ct
- 8048 Green Valley Dr
- 8000 Long Trail Dr
- 8229 Forest Glenn
- 7716 Bridlewood Ct
- 8316 Westwind Ln
- 8428 Hidden Creek Ct
- 8133 Pecan Ridge Dr
- 8324 Flat Rock Ct
- 8417 Patricks Path
- 8308 Johns Way
- 8600 Foxwood Dr
- 8200 Thornhill Dr
- 7708 Ridgeway Ct
- 7716 Evergreen Ave
- 7404 Forrest Ln
- 8420 Grand View Dr
- 8436 Parkdale Dr
- 8108 Autumn Run Ln
- 8100 Autumn Run Ln
- 8109 Fireside Dr
- 8105 Fireside Dr
- 8113 Fireside Dr
- 8101 Autumn Run Ln
- 8101 Fireside Dr
- 8105 Autumn Run Ln
- 8117 Fireside Dr
- 8109 Autumn Run Ln
- 8116 Autumn Run Ln
- 7925 Whispering Woods Ln
- 7929 Whispering Woods Ln
- 8121 Fireside Dr
- 7921 Whispering Woods Ln
- 7916 Whispering Woods Ln
- 7933 Whispering Woods Ln
- 8112 Fireside Dr
- 8116 Fireside Dr
- 8108 Fireside Dr