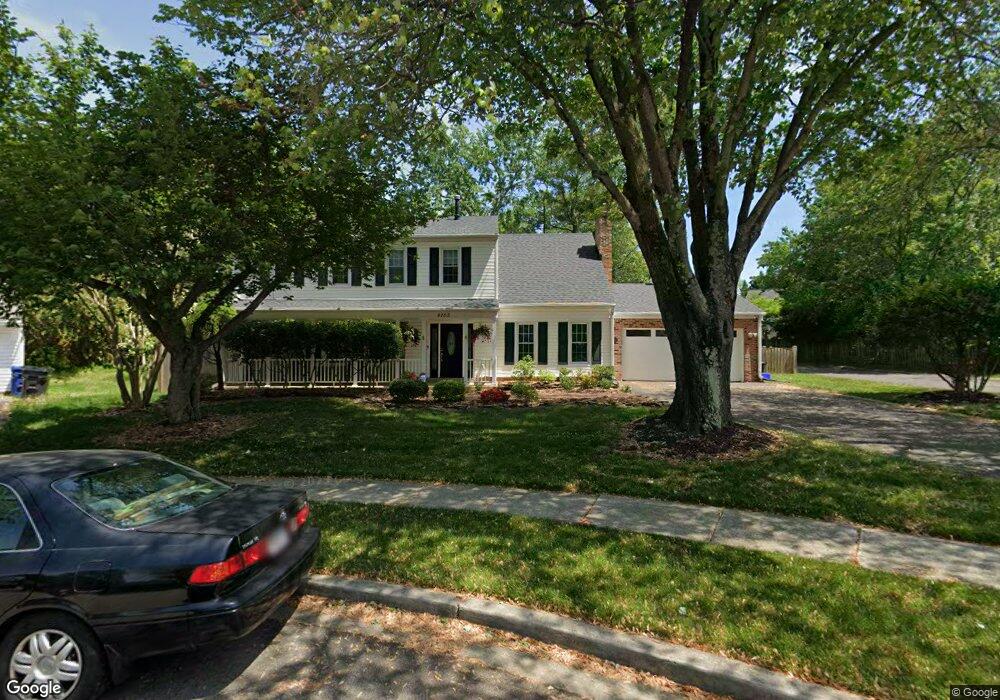
8105 Saint David Ct Springfield, VA 22153
Estimated Value: $789,000 - $822,000
5
Beds
4
Baths
2,296
Sq Ft
$352/Sq Ft
Est. Value
About This Home
This home is located at 8105 Saint David Ct, Springfield, VA 22153 and is currently estimated at $807,795, approximately $351 per square foot. 8105 Saint David Ct is a home located in Fairfax County with nearby schools including Saratoga Elementary School, Key Middle, and Lewis High School.
Ownership History
Date
Name
Owned For
Owner Type
Purchase Details
Closed on
Jun 24, 2020
Sold by
Keast Kevin M and Keast Louise M
Bought by
Keast Kevin M and Keast Louise M
Current Estimated Value
Purchase Details
Closed on
Feb 15, 2007
Sold by
Prudential Relocation Inc
Bought by
Keast Kevin M
Home Financials for this Owner
Home Financials are based on the most recent Mortgage that was taken out on this home.
Original Mortgage
$417,000
Outstanding Balance
$251,703
Interest Rate
6.3%
Mortgage Type
New Conventional
Estimated Equity
$556,092
Purchase Details
Closed on
Mar 6, 2006
Sold by
Ambrosini Robert J
Bought by
Prudential Relocation Inc
Purchase Details
Closed on
Apr 19, 2002
Sold by
Withers Family Trust
Bought by
Ambrosini Robert
Home Financials for this Owner
Home Financials are based on the most recent Mortgage that was taken out on this home.
Original Mortgage
$288,800
Interest Rate
6.85%
Mortgage Type
New Conventional
Create a Home Valuation Report for This Property
The Home Valuation Report is an in-depth analysis detailing your home's value as well as a comparison with similar homes in the area
Home Values in the Area
Average Home Value in this Area
Purchase History
| Date | Buyer | Sale Price | Title Company |
|---|---|---|---|
| Keast Kevin M | -- | None Available | |
| Keast Kevin M | $535,000 | -- | |
| Prudential Relocation Inc | $659,000 | -- | |
| Ambrosini Robert | $361,000 | -- |
Source: Public Records
Mortgage History
| Date | Status | Borrower | Loan Amount |
|---|---|---|---|
| Open | Keast Kevin M | $417,000 | |
| Previous Owner | Ambrosini Robert | $288,800 |
Source: Public Records
Tax History
| Year | Tax Paid | Tax Assessment Tax Assessment Total Assessment is a certain percentage of the fair market value that is determined by local assessors to be the total taxable value of land and additions on the property. | Land | Improvement |
|---|---|---|---|---|
| 2025 | $8,079 | $713,740 | $284,000 | $429,740 |
| 2024 | $8,079 | $697,370 | $269,000 | $428,370 |
| 2023 | $7,757 | $687,360 | $269,000 | $418,360 |
| 2022 | $7,630 | $667,210 | $259,000 | $408,210 |
| 2021 | $7,038 | $599,770 | $229,000 | $370,770 |
| 2020 | $6,674 | $563,880 | $214,000 | $349,880 |
| 2019 | $6,528 | $551,570 | $204,000 | $347,570 |
| 2018 | $6,265 | $544,750 | $204,000 | $340,750 |
| 2017 | $6,037 | $520,010 | $194,000 | $326,010 |
| 2016 | $6,047 | $522,010 | $196,000 | $326,010 |
| 2015 | $5,767 | $516,780 | $194,000 | $322,780 |
| 2014 | $5,506 | $494,490 | $184,000 | $310,490 |
Source: Public Records
Map
Nearby Homes
- 7865 Parthian Ct
- 8068 Dulciana Ct
- 7936 Saint Dennis Dr
- 7923 Lake Pleasant Dr
- 8020 Pohick Rd
- 8371 Luce Ct
- 7594 Woodstown Dr
- 7669 Oak Field Ct
- 8495 Kitchener Dr
- 8298 Lindside Way
- 7719 Durer Ct
- 8309 Magic Leaf Rd
- 7673 Northern Oaks Ct
- 8303 White Star Ct
- 8431 Ambrose Ct
- 7752 Gamid Dr
- 7758 Tara Heights Place
- 7433 Spring Tree Dr
- 8580 Tyrolean Way
- 7749 Milford Haven Dr Unit 49A
- 8107 Saint David Ct
- 8103 Saint David Ct
- 8101 Saint David Ct
- 8109 Saint David Ct
- 8072 Powderbrook Ln
- 8070 Powderbrook Ln
- 8074 Powderbrook Ln
- 8076 Powderbrook Ln
- 8068 Powderbrook Ln
- 8078 Powderbrook Ln
- 8066 Powderbrook Ln
- 8082 Powderbrook Ln
- 8064 Powderbrook Ln
- 8084 Powderbrook Ln
- 8062 Powderbrook Ln
- 8060 Powderbrook Ln
- 8086 Powderbrook Ln
- 8121 Lake Pleasant Dr
- 8058 Powderbrook Ln
- 8088 Powderbrook Ln
Your Personal Tour Guide
Ask me questions while you tour the home.