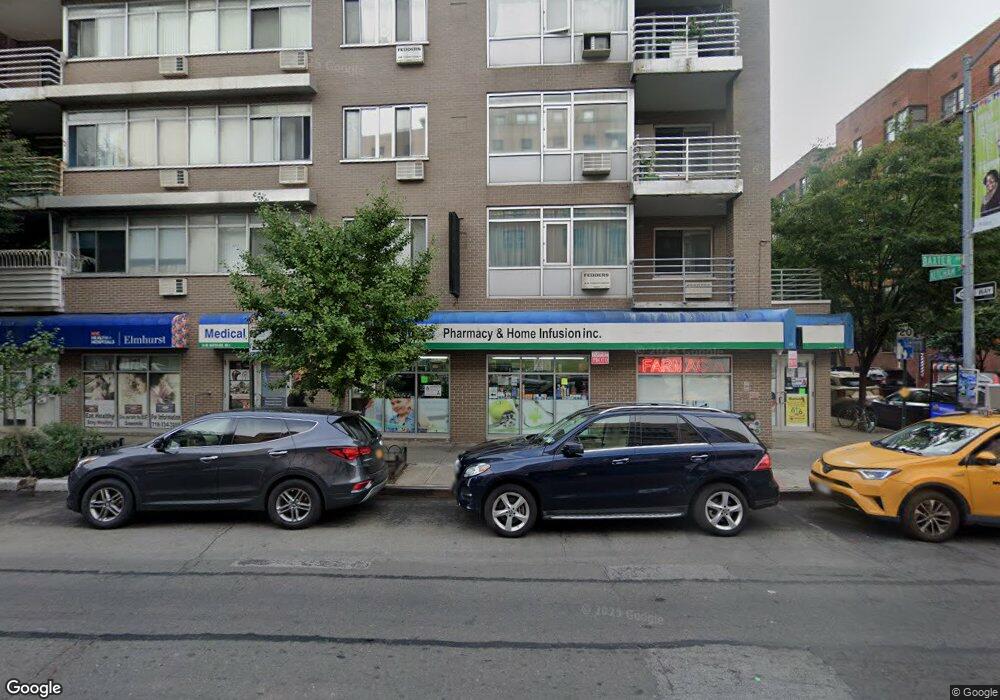
8106 Baxter Ave Unit 3A Elmhurst, NY 11373
Elmhurst NeighborhoodEstimated Value: $582,345 - $641,000
2
Beds
2
Baths
767
Sq Ft
$807/Sq Ft
Est. Value
About This Home
This home is located at 8106 Baxter Ave Unit 3A, Elmhurst, NY 11373 and is currently estimated at $618,836, approximately $806 per square foot. 8106 Baxter Ave Unit 3A is a home located in Queens County with nearby schools including P.S. 7 Louis F Simeone, Is 5 The Walter Crowley Intermediate School, and Newtown High School.
Ownership History
Date
Name
Owned For
Owner Type
Purchase Details
Closed on
Feb 14, 2020
Sold by
Chen Zhiwei and Lu Shuangyu
Bought by
Chuang Li-Ling and Huang Yin-Chie
Current Estimated Value
Purchase Details
Closed on
Jul 5, 2016
Sold by
Chen Longhua and Chen Zhiwei
Bought by
Chen Zhiwei and Lu Shuangyu
Purchase Details
Closed on
Nov 25, 2015
Sold by
Chen Yi and Lin Xiaofei
Bought by
Chen Longhua and Chen Zhiwei
Purchase Details
Closed on
Sep 14, 2009
Sold by
Forever Spring Realty Inc and Wayne Capital Inc
Bought by
Chen Yi and Lin Xiao Fei
Home Financials for this Owner
Home Financials are based on the most recent Mortgage that was taken out on this home.
Original Mortgage
$200,000
Interest Rate
5.31%
Mortgage Type
Purchase Money Mortgage
Create a Home Valuation Report for This Property
The Home Valuation Report is an in-depth analysis detailing your home's value as well as a comparison with similar homes in the area
Home Values in the Area
Average Home Value in this Area
Purchase History
| Date | Buyer | Sale Price | Title Company |
|---|---|---|---|
| Chuang Li-Ling | $619,000 | -- | |
| Chuang Li-Ling | $619,000 | -- | |
| Chen Zhiwei | -- | -- | |
| Chen Zhiwei | -- | -- | |
| Chen Longhua | $430,000 | -- | |
| Chen Longhua | $430,000 | -- | |
| Chen Yi | $390,000 | -- | |
| Chen Yi | $390,000 | -- |
Source: Public Records
Mortgage History
| Date | Status | Borrower | Loan Amount |
|---|---|---|---|
| Previous Owner | Chen Yi | $200,000 |
Source: Public Records
Tax History Compared to Growth
Tax History
| Year | Tax Paid | Tax Assessment Tax Assessment Total Assessment is a certain percentage of the fair market value that is determined by local assessors to be the total taxable value of land and additions on the property. | Land | Improvement |
|---|---|---|---|---|
| 2025 | $170 | $65,691 | $11,173 | $54,518 |
| 2024 | $170 | $63,732 | $11,173 | $52,559 |
| 2023 | $170 | $61,684 | $11,173 | $50,511 |
| 2022 | $166 | $60,882 | $11,173 | $49,709 |
| 2021 | $167 | $54,342 | $11,173 | $43,169 |
| 2020 | $169 | $61,344 | $11,173 | $50,171 |
| 2019 | $170 | $62,423 | $11,173 | $51,250 |
| 2018 | $173 | $53,249 | $11,173 | $42,076 |
| 2017 | $173 | $50,927 | $11,172 | $39,755 |
| 2016 | $176 | $50,927 | $11,172 | $39,755 |
| 2015 | $137 | $47,470 | $11,172 | $36,298 |
| 2014 | $137 | $46,010 | $11,173 | $34,837 |
Source: Public Records
Map
Nearby Homes
- 42-22 Ketcham St Unit 10E
- 42-22 Ketcham St Unit D9
- 4222 Ketcham St Unit F16
- 42-04 Layton St Unit 311
- 8114 Baxter Ave Unit 1E
- 42-52 Layton St Unit 1H
- 42-52 Layton St Unit 6F
- 42-52 Layton St Unit 3H
- 83-08 Pettit Ave
- 83-10 Pettit Ave
- 81-09 41st Ave Unit 5B
- 40-66 Ithaca St Unit 6D
- 40-35 Ithaca St Unit 3D
- 4035 Ithaca St Unit 1C
- 4035 Ithaca St Unit 5B
- 42-26 81st St Unit 2J
- 42-26 81st St Unit 7
- 40-18 Hampton St Unit 6-D
- 40-29 81st St
- 42-25 80th St Unit 5T
- 8106 Baxter Ave Unit 6D
- 8106 Baxter Ave Unit 6C
- 8106 Baxter Ave Unit 6B
- 8106 Baxter Ave Unit 6A
- 8106 Baxter Ave Unit 5D
- 8106 Baxter Ave Unit 5C
- 8106 Baxter Ave Unit 5B
- 8106 Baxter Ave Unit 5A
- 8106 Baxter Ave Unit 4D
- 8106 Baxter Ave Unit 4C
- 8106 Baxter Ave Unit 4B
- 8106 Baxter Ave Unit 4A
- 8106 Baxter Ave Unit 3D
- 8106 Baxter Ave Unit 3C
- 8106 Baxter Ave Unit 3B
- 8106 Baxter Ave Unit 2E
- 8106 Baxter Ave Unit 2D
- 8106 Baxter Ave Unit 2C
- 8106 Baxter Ave Unit 2B
- 8106 Baxter Ave Unit 2A