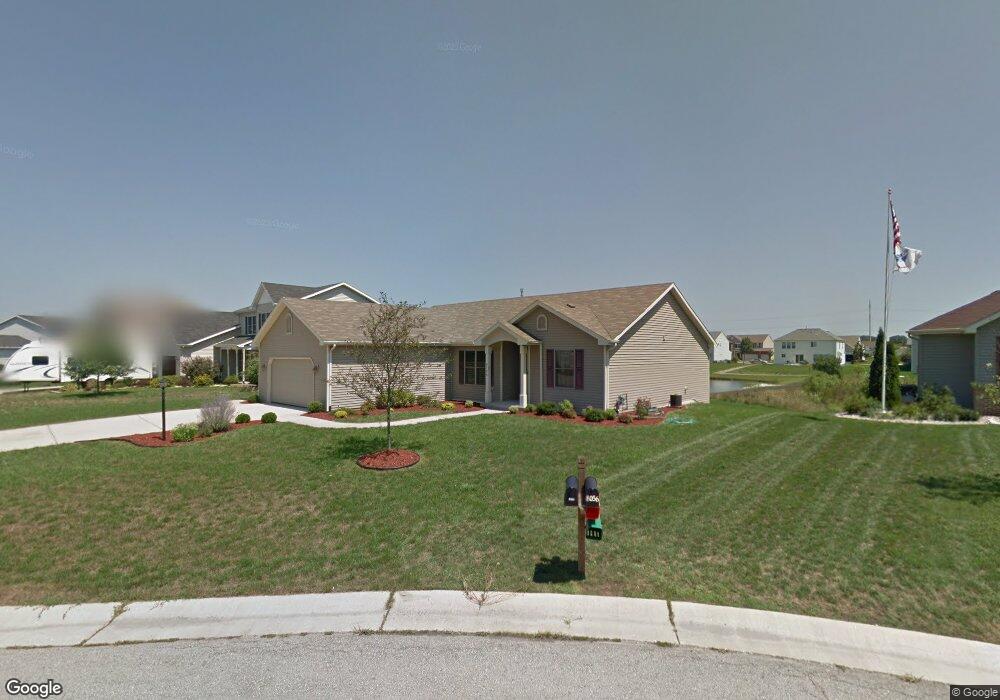
8106 Doe Glen Ct Mount Pleasant, WI 53406
Estimated Value: $467,511 - $486,000
3
Beds
2
Baths
1,711
Sq Ft
$280/Sq Ft
Est. Value
About This Home
This home is located at 8106 Doe Glen Ct, Mount Pleasant, WI 53406 and is currently estimated at $479,878, approximately $280 per square foot. 8106 Doe Glen Ct is a home located in Racine County with nearby schools including Gifford Elementary School, Case High School, and John Paul II Academy.
Ownership History
Date
Name
Owned For
Owner Type
Purchase Details
Closed on
Jul 9, 2019
Sold by
Kenyon Elmer L and Kenyon Tamie A
Bought by
Zavala Raymundo and Garcia Luz C Lopez
Current Estimated Value
Home Financials for this Owner
Home Financials are based on the most recent Mortgage that was taken out on this home.
Original Mortgage
$251,550
Outstanding Balance
$220,742
Interest Rate
3.9%
Mortgage Type
Adjustable Rate Mortgage/ARM
Estimated Equity
$259,136
Purchase Details
Closed on
May 24, 2013
Sold by
Ramiah Aravind and Ramiah Swarna
Bought by
Kenyon Elmer L and Kenyon Tamie A
Home Financials for this Owner
Home Financials are based on the most recent Mortgage that was taken out on this home.
Original Mortgage
$206,196
Interest Rate
3.37%
Mortgage Type
FHA
Purchase Details
Closed on
May 29, 2009
Sold by
Ramiah Aravind and Ramiah Swarna
Bought by
Swarna Ramiah Aravind and Swarna Ramaih
Home Financials for this Owner
Home Financials are based on the most recent Mortgage that was taken out on this home.
Original Mortgage
$188,200
Interest Rate
4.51%
Mortgage Type
New Conventional
Create a Home Valuation Report for This Property
The Home Valuation Report is an in-depth analysis detailing your home's value as well as a comparison with similar homes in the area
Home Values in the Area
Average Home Value in this Area
Purchase History
| Date | Buyer | Sale Price | Title Company |
|---|---|---|---|
| Zavala Raymundo | $279,500 | None Available | |
| Kenyon Elmer L | $210,000 | None Available | |
| Swarna Ramiah Aravind | -- | None Available |
Source: Public Records
Mortgage History
| Date | Status | Borrower | Loan Amount |
|---|---|---|---|
| Open | Zavala Raymundo | $251,550 | |
| Previous Owner | Kenyon Elmer L | $206,196 | |
| Previous Owner | Swarna Ramiah Aravind | $188,200 |
Source: Public Records
Tax History Compared to Growth
Tax History
| Year | Tax Paid | Tax Assessment Tax Assessment Total Assessment is a certain percentage of the fair market value that is determined by local assessors to be the total taxable value of land and additions on the property. | Land | Improvement |
|---|---|---|---|---|
| 2024 | $6,635 | $423,900 | $59,200 | $364,700 |
| 2023 | $6,135 | $381,900 | $55,400 | $326,500 |
| 2022 | $5,844 | $360,000 | $55,400 | $304,600 |
| 2021 | $6,251 | $342,800 | $50,300 | $292,500 |
| 2020 | $5,383 | $286,600 | $46,400 | $240,200 |
| 2019 | $5,525 | $307,500 | $46,400 | $261,100 |
| 2018 | $5,074 | $262,700 | $38,100 | $224,600 |
| 2017 | $4,805 | $244,600 | $38,100 | $206,500 |
| 2016 | $4,819 | $205,600 | $31,700 | $173,900 |
| 2015 | $4,226 | $205,600 | $31,700 | $173,900 |
| 2014 | $3,916 | $201,900 | $31,700 | $170,200 |
| 2013 | $4,154 | $201,900 | $31,700 | $170,200 |
Source: Public Records
Map
Nearby Homes
- 2735 Deer Creek Dr
- 2739 Deer Creek Dr
- 8388 Creek View Ln
- Lt130 Hoods Creek Path
- Lt131 Hoods Creek Path
- Lt108 Hoods Creek Path
- 2352 Hoods Creek Path
- Lt129 Hoods Creek Path
- 2332 Hoods Creek Path
- Lt114 Hoods Creek Path
- Lt118 Hoods Creek Path
- 2402 Hoods Creek Path
- Lt123 Gwendolyns Walk
- Lt122 Gwendowlyns Walk
- 9105 Gittings Rd
- 3626 Haymeadow Rd
- 6457 Norfolk Ln
- Lt3 N Stuart Rd
- Lt0 Old Spring St
- 1053 Tallgrass Ln
- 8116 Doe Glen Ct
- 8056 Doe Glen Ct
- 8126 Doe Glen Ct
- 8046 Doe Glen Ct
- 8125 Doe Glen Ct
- 8115 Doe Glen Ct
- 8036 Doe Glen Ct
- 2723 Deer Creek Dr
- 8105 Doe Glen Ct
- 8135 Doe Glen Ct
- 8055 Doe Glen Ct
- 2727 Deer Creek Dr
- 2716 Red Fawn Ct
- 2720 Red Fawn Ct
- 2724 Red Fawn Ct
- 8205 Doe Glen Ct
- 2712 Red Fawn Ct
- 8215 Doe Glen Ct
- 2728 Deer Creek Dr
- 2732 Red Fawn Ct