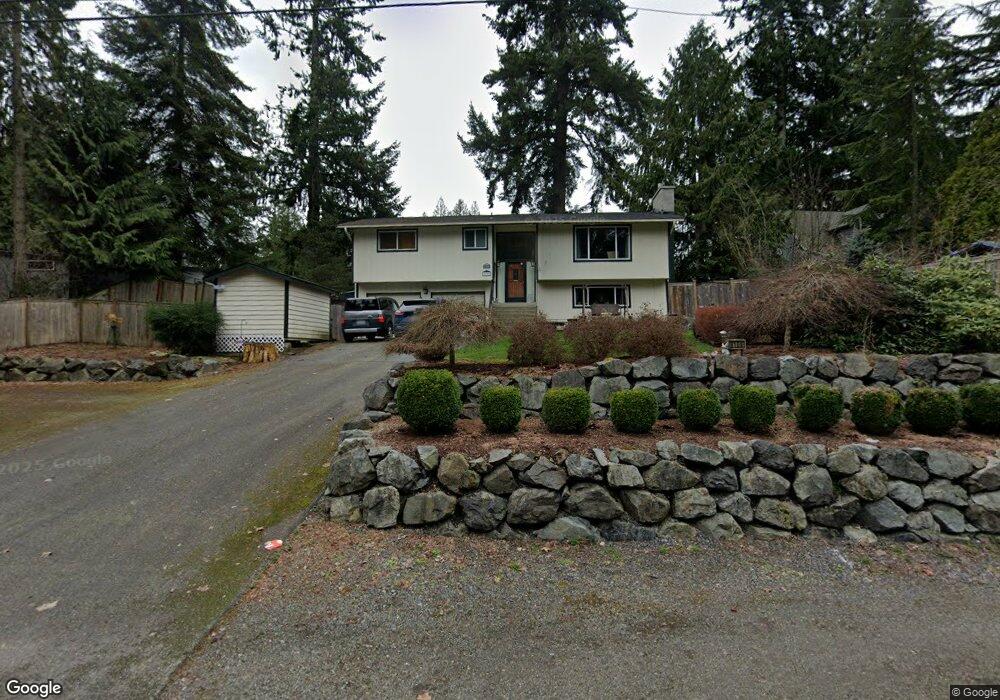
8108 E Glen Dr Everett, WA 98203
Evergreen NeighborhoodEstimated Value: $675,701 - $750,000
4
Beds
2
Baths
1,860
Sq Ft
$379/Sq Ft
Est. Value
About This Home
This home is located at 8108 E Glen Dr, Everett, WA 98203 and is currently estimated at $705,175, approximately $379 per square foot. 8108 E Glen Dr is a home located in Snohomish County with nearby schools including Lowell Elementary School, Evergreen Middle School, and Cascade High School.
Ownership History
Date
Name
Owned For
Owner Type
Purchase Details
Closed on
Apr 28, 2004
Sold by
Ronnie Ritchie and Ronnie Elizabeth
Bought by
Trnka Wayne and Trnka Sharon
Current Estimated Value
Home Financials for this Owner
Home Financials are based on the most recent Mortgage that was taken out on this home.
Original Mortgage
$207,740
Outstanding Balance
$96,372
Interest Rate
5.35%
Mortgage Type
FHA
Estimated Equity
$608,803
Purchase Details
Closed on
Sep 26, 2000
Sold by
Siler Jeffrey A and Siler Victoria L
Bought by
Ronnie Ritchie and Ronnie Elizabeth
Home Financials for this Owner
Home Financials are based on the most recent Mortgage that was taken out on this home.
Original Mortgage
$141,560
Interest Rate
10%
Purchase Details
Closed on
Dec 10, 1997
Sold by
Delamare Paul J
Bought by
Siler Jeffrey A and Siler Victoria L
Home Financials for this Owner
Home Financials are based on the most recent Mortgage that was taken out on this home.
Original Mortgage
$119,950
Interest Rate
7.19%
Create a Home Valuation Report for This Property
The Home Valuation Report is an in-depth analysis detailing your home's value as well as a comparison with similar homes in the area
Home Values in the Area
Average Home Value in this Area
Purchase History
| Date | Buyer | Sale Price | Title Company |
|---|---|---|---|
| Trnka Wayne | $211,000 | Chicago Title | |
| Ronnie Ritchie | $176,950 | Chicago Title Insurance Co | |
| Siler Jeffrey A | $149,950 | -- |
Source: Public Records
Mortgage History
| Date | Status | Borrower | Loan Amount |
|---|---|---|---|
| Open | Trnka Wayne | $207,740 | |
| Previous Owner | Ronnie Ritchie | $141,560 | |
| Previous Owner | Siler Jeffrey A | $119,950 | |
| Closed | Ronnie Ritchie | $35,390 |
Source: Public Records
Tax History
| Year | Tax Paid | Tax Assessment Tax Assessment Total Assessment is a certain percentage of the fair market value that is determined by local assessors to be the total taxable value of land and additions on the property. | Land | Improvement |
|---|---|---|---|---|
| 2025 | $950 | $594,800 | $361,200 | $233,600 |
| 2024 | $950 | $556,800 | $323,200 | $233,600 |
| 2023 | $1,034 | $616,100 | $347,000 | $269,100 |
| 2022 | $4,435 | $483,500 | $263,200 | $220,300 |
| 2020 | $4,466 | $397,100 | $206,200 | $190,900 |
| 2019 | $4,178 | $374,000 | $187,200 | $186,800 |
| 2018 | $4,107 | $337,000 | $169,100 | $167,900 |
| 2017 | $3,685 | $301,200 | $145,400 | $155,800 |
| 2016 | $3,150 | $270,600 | $115,200 | $155,400 |
Source: Public Records
Map
Nearby Homes
- 7910 E Glen Dr
- 126 W Casino Rd Unit 5
- 9 76th St SE
- 7525 Beverly Ln
- 323 75th St SE Unit A14
- 323 75th St SE Unit B10
- 501 75th Place SW
- 615 75th St SE Unit C53
- 615 75th St SE Unit C52
- 8911 Holly Dr Unit 104
- 8823 Holly Dr Unit D203
- 8823 Holly Dr Unit C102
- 8823 Holly Dr Unit H206
- 8823 Holly Dr Unit H204
- 747 75th St SE Unit B203
- 820 Cady Rd Unit H304
- 820 Cady Rd Unit B305
- 820 Cady Rd Unit F103
- 6916 Beverly Ln
- 226 93rd Place SW Unit 8
- 8010 E Glen Dr
- 8110 E Glen Dr
- 8023 W Glen Dr
- 8017 W Glen Dr
- 8006 E Glen Dr
- 8109 E Glen Dr
- 8005 E Glen Dr
- 8011 W Glen Dr
- 8007 E Glen Dr
- 8004 E Glen Dr
- 8011 Meridian Ave
- 8011 Meridian Ave Unit Lot47
- 8125 E Glen Dr
- 11 79th Place SE
- 11 79th Place SE
- 8003 E Glen Dr
- 8007 Meridian Ave
- 8007 Meridian Ave Unit Lot46
Your Personal Tour Guide
Ask me questions while you tour the home.