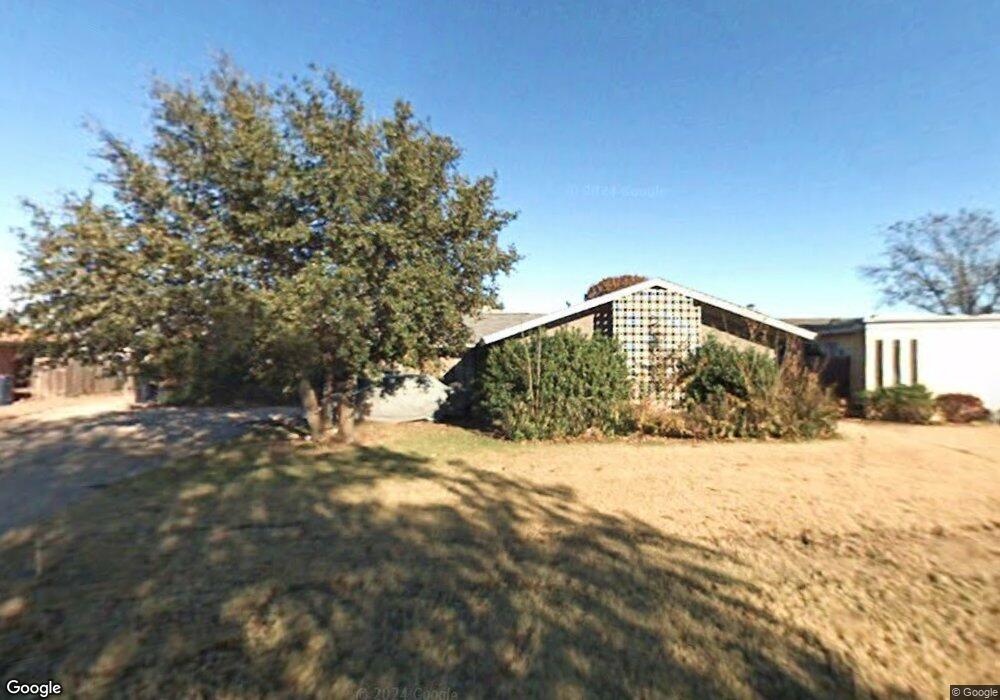
8108 W Lakeshore Dr Oklahoma City, OK 73132
Lakeshore Estates NeighborhoodEstimated Value: $204,000 - $247,150
3
Beds
2
Baths
1,961
Sq Ft
$119/Sq Ft
Est. Value
About This Home
This home is located at 8108 W Lakeshore Dr, Oklahoma City, OK 73132 and is currently estimated at $233,788, approximately $119 per square foot. 8108 W Lakeshore Dr is a home located in Oklahoma County with nearby schools including Wiley Post Elementary School, Hefner Middle School, and Putnam City North High School.
Ownership History
Date
Name
Owned For
Owner Type
Purchase Details
Closed on
Jul 6, 2021
Sold by
Wilson Witte Anne
Bought by
Norma Anne Wilson Witte Living Trust
Current Estimated Value
Home Financials for this Owner
Home Financials are based on the most recent Mortgage that was taken out on this home.
Original Mortgage
$120,000
Outstanding Balance
$105,419
Interest Rate
3.02%
Estimated Equity
$128,369
Purchase Details
Closed on
Jun 29, 2021
Sold by
Witte Hunt Kevin Andrew and Anne Wilson Witte Living Trust
Bought by
Witte Hunt Kyle Alexander and Witte Hunt Joy
Home Financials for this Owner
Home Financials are based on the most recent Mortgage that was taken out on this home.
Original Mortgage
$120,000
Outstanding Balance
$105,419
Interest Rate
3.02%
Estimated Equity
$128,369
Purchase Details
Closed on
Oct 10, 2017
Sold by
Witte Anne Wilson
Bought by
Witte Anne Wilson and Witte Living Trust
Create a Home Valuation Report for This Property
The Home Valuation Report is an in-depth analysis detailing your home's value as well as a comparison with similar homes in the area
Home Values in the Area
Average Home Value in this Area
Purchase History
| Date | Buyer | Sale Price | Title Company |
|---|---|---|---|
| Norma Anne Wilson Witte Living Trust | -- | -- | |
| Witte Hunt Kyle Alexander | -- | Accommodation | |
| Witte Anne Wilson | -- | None Available |
Source: Public Records
Mortgage History
| Date | Status | Borrower | Loan Amount |
|---|---|---|---|
| Open | Witte Hunt Kyle Alexander | $120,000 |
Source: Public Records
Tax History Compared to Growth
Tax History
| Year | Tax Paid | Tax Assessment Tax Assessment Total Assessment is a certain percentage of the fair market value that is determined by local assessors to be the total taxable value of land and additions on the property. | Land | Improvement |
|---|---|---|---|---|
| 2024 | $2,491 | $21,455 | $3,333 | $18,122 |
| 2023 | $2,491 | $20,434 | $3,369 | $17,065 |
| 2022 | $2,402 | $19,461 | $3,548 | $15,913 |
| 2021 | $2,266 | $18,535 | $3,630 | $14,905 |
| 2020 | $2,171 | $17,844 | $3,558 | $14,286 |
| 2019 | $1,917 | $16,995 | $3,461 | $13,534 |
| 2018 | $1,920 | $16,995 | $0 | $0 |
| 2017 | $1,864 | $16,504 | $3,034 | $13,470 |
| 2016 | $1,803 | $16,023 | $3,194 | $12,829 |
| 2015 | $1,768 | $15,556 | $3,245 | $12,311 |
| 2014 | $1,668 | $15,278 | $2,962 | $12,316 |
Source: Public Records
Map
Nearby Homes
- 5712 Lawson Ln
- 5600 NW 83rd St
- 5621 NW 83rd St
- 5816 NW 83rd St
- 5708 NW 87th St
- 7725 NW 81st St
- 5801 NW 86th St
- 8617 NW 76th St
- 8613 NW 76th St
- 8100 Brookside Dr
- 6001 Broadmoor Ave
- 6038 Northwest Expy
- 6012 Broadmoor Ave
- 7705 Rumsey Rd
- 8721 Old Brompton Rd
- 6030 Northwest Expy Unit D
- 6000 Marlow Ln
- 6005 Harwich Manor St
- 6032 Broadmoor Ave
- 7512 Rumsey Rd
- 8112 W Lakeshore Dr
- 8104 W Lakeshore Dr
- 8105 W Lakeshore Dr
- 8100 W Lakeshore Dr
- 8116 W Lakeshore Dr
- 8109 W Lakeshore Dr
- 8101 W Lakeshore Dr
- 8016 W Lakeshore Dr
- 5701 Melton Dr
- 5704 Melton Dr
- 5705 Lawson Ln
- 8012 W Lakeshore Dr
- 5705 Melton Dr
- 5708 Melton Dr
- 8009 W Lakeshore Dr
- 5709 Lawson Ln
- 5709 Melton Dr
- 5704 Lawson Ln
- 8008 W Lakeshore Dr
- 5712 Melton Dr