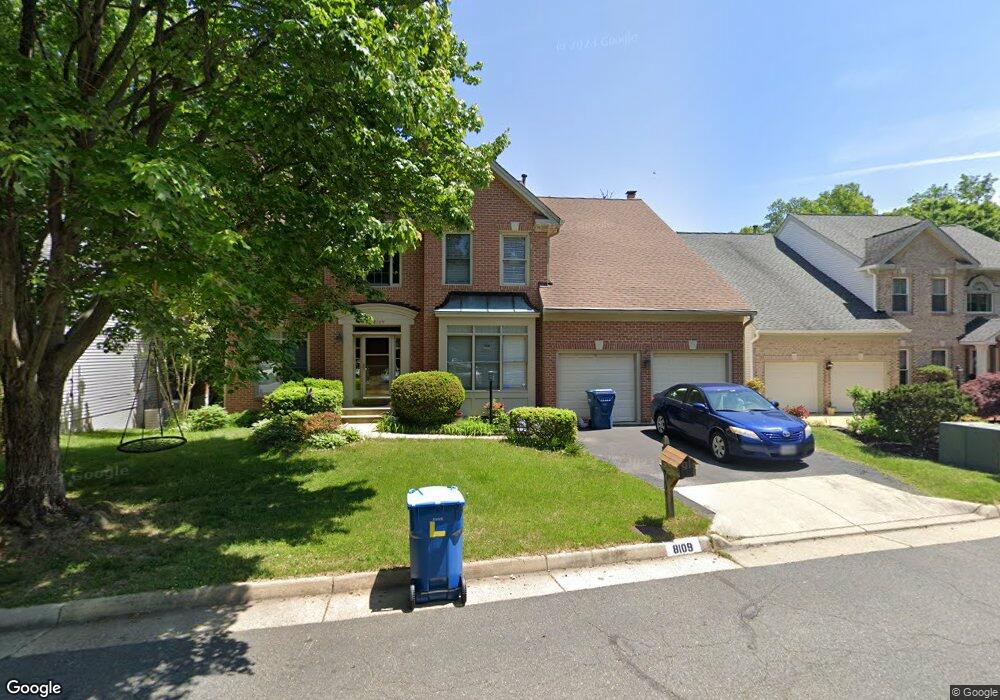
8109 Creekview Dr Springfield, VA 22153
Estimated Value: $1,091,002 - $1,205,000
5
Beds
4
Baths
3,480
Sq Ft
$331/Sq Ft
Est. Value
About This Home
This home is located at 8109 Creekview Dr, Springfield, VA 22153 and is currently estimated at $1,150,251, approximately $330 per square foot. 8109 Creekview Dr is a home located in Fairfax County with nearby schools including Hunt Valley Elementary School, Irving Middle School, and West Springfield High School.
Ownership History
Date
Name
Owned For
Owner Type
Purchase Details
Closed on
Sep 20, 2019
Sold by
Lee Edmund Tesen and Doan Lee Thi Nhu Ngoc
Bought by
Lee Edmund Tesen and Doan Lee Thi Nhu Ngoc
Current Estimated Value
Purchase Details
Closed on
Apr 29, 2011
Sold by
Kim Chon S
Bought by
Lee Edmund T and Doan Thi N N
Home Financials for this Owner
Home Financials are based on the most recent Mortgage that was taken out on this home.
Original Mortgage
$575,505
Interest Rate
4.88%
Mortgage Type
VA
Purchase Details
Closed on
Nov 30, 1995
Sold by
Lasalvia Ronald A
Bought by
Kim Shon S
Home Financials for this Owner
Home Financials are based on the most recent Mortgage that was taken out on this home.
Original Mortgage
$256,900
Interest Rate
7.37%
Create a Home Valuation Report for This Property
The Home Valuation Report is an in-depth analysis detailing your home's value as well as a comparison with similar homes in the area
Home Values in the Area
Average Home Value in this Area
Purchase History
| Date | Buyer | Sale Price | Title Company |
|---|---|---|---|
| Lee Edmund Tesen | -- | None Available | |
| Lee Edmund T | $630,000 | -- | |
| Kim Shon S | $367,000 | -- |
Source: Public Records
Mortgage History
| Date | Status | Borrower | Loan Amount |
|---|---|---|---|
| Previous Owner | Lee Edmund T | $575,505 | |
| Previous Owner | Kim Shon S | $256,900 |
Source: Public Records
Tax History Compared to Growth
Tax History
| Year | Tax Paid | Tax Assessment Tax Assessment Total Assessment is a certain percentage of the fair market value that is determined by local assessors to be the total taxable value of land and additions on the property. | Land | Improvement |
|---|---|---|---|---|
| 2025 | $11,967 | $1,046,390 | $319,000 | $727,390 |
| 2024 | $11,967 | $1,032,970 | $309,000 | $723,970 |
| 2023 | $11,434 | $1,013,230 | $309,000 | $704,230 |
| 2022 | $9,997 | $874,240 | $269,000 | $605,240 |
| 2021 | $9,136 | $778,500 | $249,000 | $529,500 |
| 2020 | $8,854 | $748,080 | $234,000 | $514,080 |
| 2019 | $8,794 | $743,080 | $229,000 | $514,080 |
| 2018 | $8,138 | $707,630 | $229,000 | $478,630 |
| 2017 | $8,216 | $707,630 | $229,000 | $478,630 |
| 2016 | $7,978 | $688,640 | $219,000 | $469,640 |
| 2015 | $7,316 | $655,580 | $204,000 | $451,580 |
| 2014 | $7,244 | $650,580 | $199,000 | $451,580 |
Source: Public Records
Map
Nearby Homes
- 7743 Middle Valley Dr
- 7729 Middle Valley Dr
- 8312 Timber Brook Ln
- 8000 Lady Lewis Ct
- 7354 Hidden Knolls Ct
- 7757 Tara Heights Place
- 7310 Eggar Woods Ln
- 8420 Sweet Pine Ct
- 8375 Magic Leaf Rd
- 0 Edge Creek Ln
- 7217 Jillspring Ct Unit 21A
- 7808 Tower Woods Dr
- 7206 Joshua Tree Ln
- 8580 Tyrolean Way
- 8019 Tanworth Ct
- 8026 Readington Ct
- 8068 Dulciana Ct
- 8110 Northumberland Rd
- 8110 Winter Blue Ct
- 7676 Green Garland Dr
- 8111 Creekview Dr
- 8107 Creekview Dr
- 8115 Creekview Dr
- 8113 Creekview Dr
- 8105 Creekview Dr
- 8116 Creekview Dr
- 8111 Ridge Creek Way
- 8110 Creekview Dr
- 8113 Ridge Creek Way
- 8103 Creekview Dr
- 8164 Ships Curve Ln
- 8115 Ridge Creek Way
- 8104 Creekview Dr
- 8162 Ships Curve Ln
- 8114 Ridge Creek Way
- 7851 Roundabout Way
- 8117 Ridge Creek Way
- 7853 Roundabout Way
- 8101 Creekview Dr
- 8160 Ships Curve Ln