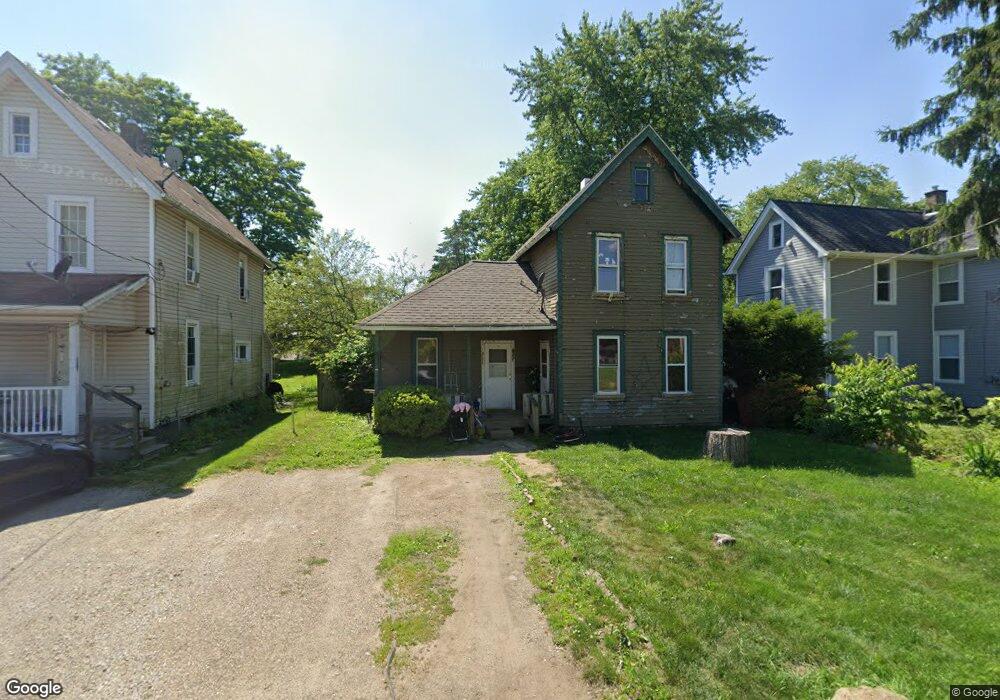
811 11th St SE Massillon, OH 44646
Downtown Massillon NeighborhoodEstimated Value: $53,000 - $62,000
2
Beds
1
Bath
1,232
Sq Ft
$48/Sq Ft
Est. Value
About This Home
This home is located at 811 11th St SE, Massillon, OH 44646 and is currently estimated at $58,667, approximately $47 per square foot. 811 11th St SE is a home located in Stark County with nearby schools including Massillon Intermediate School, Massillon Junior High School, and Washington High School.
Ownership History
Date
Name
Owned For
Owner Type
Purchase Details
Closed on
Jul 24, 2020
Sold by
Millrun Structes Llc
Bought by
Flory Wesley and Morgan Ashley
Current Estimated Value
Home Financials for this Owner
Home Financials are based on the most recent Mortgage that was taken out on this home.
Original Mortgage
$45,000
Outstanding Balance
$39,903
Interest Rate
3.1%
Mortgage Type
Land Contract Argmt. Of Sale
Estimated Equity
$18,764
Purchase Details
Closed on
Apr 4, 2011
Sold by
Amish Millworks Llc
Bought by
Millrun Structures Llc
Purchase Details
Closed on
Jun 16, 2010
Sold by
Lakeside Capital Group Llc
Bought by
Millworks Amish
Purchase Details
Closed on
Mar 15, 2010
Sold by
Federal Home Loan Mortgage Corporation
Bought by
Lakeside Capital Group Llc
Purchase Details
Closed on
Sep 9, 2009
Sold by
Jennings Adalbert M
Bought by
Federal Home Loan Mortgage Corp
Create a Home Valuation Report for This Property
The Home Valuation Report is an in-depth analysis detailing your home's value as well as a comparison with similar homes in the area
Home Values in the Area
Average Home Value in this Area
Purchase History
| Date | Buyer | Sale Price | Title Company |
|---|---|---|---|
| Flory Wesley | $45,000 | None Available | |
| Millrun Structures Llc | $26,300 | None Available | |
| Millworks Amish | -- | None Available | |
| Lakeside Capital Group Llc | $9,100 | None Available | |
| Federal Home Loan Mortgage Corp | $28,000 | None Available |
Source: Public Records
Mortgage History
| Date | Status | Borrower | Loan Amount |
|---|---|---|---|
| Open | Flory Wesley | $45,000 |
Source: Public Records
Tax History Compared to Growth
Tax History
| Year | Tax Paid | Tax Assessment Tax Assessment Total Assessment is a certain percentage of the fair market value that is determined by local assessors to be the total taxable value of land and additions on the property. | Land | Improvement |
|---|---|---|---|---|
| 2025 | -- | $10,850 | $5,320 | $5,530 |
| 2024 | -- | $10,850 | $5,320 | $5,530 |
| 2023 | $723 | $9,560 | $3,610 | $5,950 |
| 2022 | $508 | $9,560 | $3,610 | $5,950 |
| 2021 | $522 | $9,670 | $3,610 | $6,060 |
| 2020 | $442 | $7,700 | $2,940 | $4,760 |
| 2019 | $1,109 | $7,710 | $2,940 | $4,770 |
| 2018 | $764 | $7,710 | $2,940 | $4,770 |
| 2017 | $655 | $5,540 | $1,650 | $3,890 |
| 2016 | $643 | $5,440 | $1,300 | $4,140 |
| 2015 | $783 | $5,440 | $1,300 | $4,140 |
| 2014 | $353 | $5,610 | $1,330 | $4,280 |
| 2013 | $455 | $5,610 | $1,330 | $4,280 |
Source: Public Records
Map
Nearby Homes
- 233 Edwin Ave SE
- 1319 Walnut Rd SE
- 652 Young St SE
- 17 Maple Ave SE
- 804 Erie St S
- 1274 13th St SE
- 1225 Erie St S
- 0 Pearl SE Unit 5155028
- 202 Rose Ave SE
- 824 Oak Ave SE
- 1117 Cleveland St SW
- 509 Tremont Ave SE
- 22 Forest Ave SE
- 20 Forest Ave SE
- 1738 Erie St S
- 25 Forest Ave SE
- 21 Forest Ave SE
- 505 Neale Ave SW
- 532 4th St SW
- 46 5th St SE
- 815 11th St SE
- 805 11th St SE
- 819 11th St SE
- 343 Beckman St SE
- 827 11th St SE
- 783 11th St SE
- 808 11th St SE
- 814 11th St SE
- 820 11th St SE
- 775 11th St SE
- 1102 Beckman St SE
- 826 11th St SE
- 837 11th St SE
- 830 11th St SE
- 771 11th St SE
- 770 Fay St SE
- 772 11th St SE
- 1114 Beckman St SE
- 766 11th St SE
- 767 11th St SE