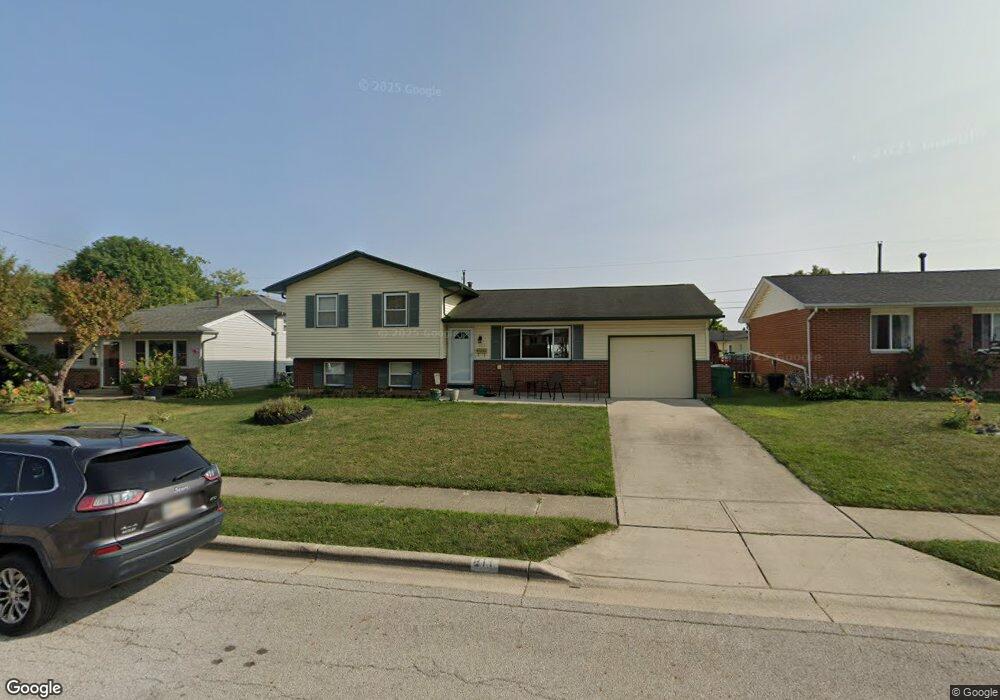
811 Brookdale Dr West Jefferson, OH 43162
Estimated Value: $226,000 - $287,000
3
Beds
2
Baths
1,508
Sq Ft
$175/Sq Ft
Est. Value
About This Home
This home is located at 811 Brookdale Dr, West Jefferson, OH 43162 and is currently estimated at $263,544, approximately $174 per square foot. 811 Brookdale Dr is a home located in Madison County with nearby schools including Norwood Elementary School, West Jefferson Middle School, and West Jefferson High School.
Ownership History
Date
Name
Owned For
Owner Type
Purchase Details
Closed on
Feb 22, 2013
Sold by
Estate Of Gary D Gilliam
Bought by
Gilliam Joseph Eric and Gilliam Kyle
Current Estimated Value
Purchase Details
Closed on
Nov 30, 2010
Sold by
Wells Fargo Bank Na
Bought by
Gilliam Gary D
Home Financials for this Owner
Home Financials are based on the most recent Mortgage that was taken out on this home.
Original Mortgage
$63,100
Interest Rate
4.84%
Mortgage Type
New Conventional
Purchase Details
Closed on
Nov 8, 2010
Sold by
Daniels Sylvia J
Bought by
Wells Fargo Bank Na
Home Financials for this Owner
Home Financials are based on the most recent Mortgage that was taken out on this home.
Original Mortgage
$63,100
Interest Rate
4.84%
Mortgage Type
New Conventional
Purchase Details
Closed on
Feb 24, 1994
Sold by
Grimm Sylvia
Bought by
Daniels Sylvia and Daniels Curtis
Purchase Details
Closed on
Sep 10, 1993
Sold by
Grimm James L
Bought by
Grimm Sylvia
Create a Home Valuation Report for This Property
The Home Valuation Report is an in-depth analysis detailing your home's value as well as a comparison with similar homes in the area
Home Values in the Area
Average Home Value in this Area
Purchase History
| Date | Buyer | Sale Price | Title Company |
|---|---|---|---|
| Gilliam Joseph Eric | -- | None Available | |
| Gilliam Gary D | $78,900 | None Available | |
| Wells Fargo Bank Na | $90,000 | None Available | |
| Daniels Sylvia | -- | -- | |
| Grimm Sylvia | $9,300 | -- |
Source: Public Records
Mortgage History
| Date | Status | Borrower | Loan Amount |
|---|---|---|---|
| Previous Owner | Gilliam Gary D | $63,100 |
Source: Public Records
Tax History Compared to Growth
Tax History
| Year | Tax Paid | Tax Assessment Tax Assessment Total Assessment is a certain percentage of the fair market value that is determined by local assessors to be the total taxable value of land and additions on the property. | Land | Improvement |
|---|---|---|---|---|
| 2024 | $2,908 | $65,760 | $16,530 | $49,230 |
| 2023 | $2,908 | $65,760 | $16,530 | $49,230 |
| 2022 | $2,288 | $48,160 | $12,170 | $35,990 |
| 2021 | $2,297 | $48,160 | $12,170 | $35,990 |
| 2020 | $2,338 | $48,160 | $12,170 | $35,990 |
| 2019 | $2,017 | $40,920 | $10,890 | $30,030 |
| 2018 | $1,928 | $40,920 | $10,890 | $30,030 |
| 2017 | $1,582 | $40,920 | $10,890 | $30,030 |
| 2016 | $1,582 | $32,840 | $10,890 | $21,950 |
| 2015 | $1,650 | $32,840 | $10,890 | $21,950 |
| 2014 | $1,650 | $32,840 | $10,890 | $21,950 |
| 2013 | -- | $27,490 | $10,860 | $16,630 |
Source: Public Records
Map
Nearby Homes
- 908 Kingsdale Ct
- 555 Kirkwood Dr
- 277 Hathaway Rd
- 1000 W Main St Unit Lot 13
- 0 W Jeff Kiousville Rd Unit 225000725
- 106 Kings Way Unit 4
- 304 Middle Dr
- 283 Madison Dr N
- 248 London Rd
- 22 N Franklin St
- 200 Smith St
- 74 S Chester St
- 125 Dogwood Ct
- 545 Trillium Dr
- 1615 Olmstead Rd
- 312 Larkspur Dr
- 430 Trillium Dr
- 1890 Wilson Rd SE
- 270 State Route 142 NE
- 360 State Route 142 NE
- 817 Brookdale Dr
- 803 Brookdale Dr
- 825 Brookdale Dr
- 814 Crescent Dr
- 795 Brookdale Dr
- 820 Crescent Dr
- 808 Crescent Dr
- 800 Crescent Dr
- 828 Crescent Dr
- 812 Brookdale Dr
- 833 Brookdale Dr
- 818 Brookdale Dr
- 800 Brookdale Dr
- 785 Brookdale Dr
- 836 Crescent Dr
- 792 Crescent Dr
- 826 Brookdale Dr
- 790 Brookdale Dr
- 839 Brookdale Dr
- 777 Brookdale Dr