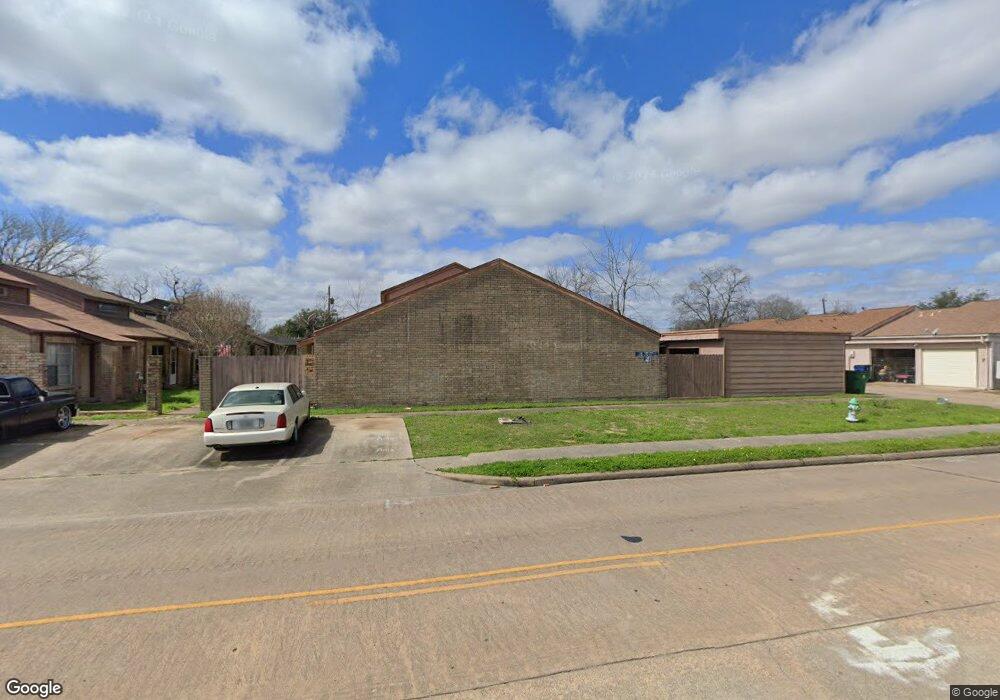
811 Buchta Rd Unit A Angleton, TX 77515
Estimated Value: $141,000 - $184,879
Studio
1
Bath
1,170
Sq Ft
$145/Sq Ft
Est. Value
About This Home
This home is located at 811 Buchta Rd Unit A, Angleton, TX 77515 and is currently estimated at $169,720, approximately $145 per square foot. 811 Buchta Rd Unit A is a home located in Brazoria County with nearby schools including Northside Elementary School, Angleton Junior High School, and Angleton High School.
Ownership History
Date
Name
Owned For
Owner Type
Purchase Details
Closed on
Feb 15, 2010
Sold by
Perez Robert and Perez Mary
Bought by
Perez Robert and Perez Mary
Current Estimated Value
Home Financials for this Owner
Home Financials are based on the most recent Mortgage that was taken out on this home.
Original Mortgage
$43,980
Outstanding Balance
$26,800
Interest Rate
3.5%
Mortgage Type
VA
Estimated Equity
$142,920
Purchase Details
Closed on
Sep 14, 1999
Sold by
Kuhns Joan C
Bought by
Perez Robert
Home Financials for this Owner
Home Financials are based on the most recent Mortgage that was taken out on this home.
Original Mortgage
$48,925
Interest Rate
7.9%
Mortgage Type
VA
Purchase Details
Closed on
Feb 2, 1996
Sold by
Visor Leslie B and Visor Bruce
Bought by
Kuhns Joan C
Purchase Details
Closed on
Mar 7, 1995
Sold by
Barker Dennis F and Barker Linda R
Bought by
First National Bank Of Lake Jackson
Create a Home Valuation Report for This Property
The Home Valuation Report is an in-depth analysis detailing your home's value as well as a comparison with similar homes in the area
Home Values in the Area
Average Home Value in this Area
Purchase History
| Date | Buyer | Sale Price | Title Company |
|---|---|---|---|
| Perez Robert | -- | National Title Network | |
| Perez Robert | -- | -- | |
| Kuhns Joan C | -- | -- | |
| First National Bank Of Lake Jackson | $18,900 | -- |
Source: Public Records
Mortgage History
| Date | Status | Borrower | Loan Amount |
|---|---|---|---|
| Open | Perez Robert | $43,980 | |
| Closed | Perez Robert | $48,925 |
Source: Public Records
Tax History
| Year | Tax Paid | Tax Assessment Tax Assessment Total Assessment is a certain percentage of the fair market value that is determined by local assessors to be the total taxable value of land and additions on the property. | Land | Improvement |
|---|---|---|---|---|
| 2025 | $609 | $167,427 | $37,350 | $131,940 |
| 2023 | $609 | $138,369 | $37,350 | $135,280 |
| 2022 | $3,089 | $125,790 | $9,100 | $116,690 |
| 2021 | $3,340 | $121,710 | $8,450 | $113,260 |
| 2020 | $3,425 | $117,670 | $6,500 | $111,170 |
| 2019 | $3,232 | $107,360 | $6,500 | $100,860 |
| 2018 | $2,992 | $97,650 | $6,500 | $91,150 |
| 2017 | $2,803 | $89,900 | $6,500 | $83,400 |
| 2016 | $2,598 | $83,300 | $6,500 | $76,800 |
| 2015 | $471 | $80,520 | $6,500 | $74,020 |
| 2014 | $471 | $78,420 | $6,500 | $71,920 |
Source: Public Records
Map
Nearby Homes
- 811 Buchta Rd Unit C
- 807 Buchta Rd Unit 21
- Springsteen Plan at Riverwood Ranch - Classic Collection
- Oxford Plan at Riverwood Ranch - Watermill Collection
- Walsh Plan at Riverwood Ranch - Classic Collection
- Newlin Plan at Riverwood Ranch - Watermill Collection
- Mccartney Plan at Riverwood Ranch - Classic Collection
- Ramsey Plan at Riverwood Ranch - Watermill Collection
- Hendrix Plan at Riverwood Ranch - Classic Collection
- Littleton Plan at Riverwood Ranch - Watermill Collection
- Nash Plan at Riverwood Ranch - Classic Collection
- Joplin Plan at Riverwood Ranch - Classic Collection
- Beckman Plan at Riverwood Ranch - Watermill Collection
- Midland Plan at Riverwood Ranch
- Harris Plan at Riverwood Ranch
- Gaven Plan at Riverwood Ranch
- Caden Plan at Riverwood Ranch
- Denton Plan at Riverwood Ranch
- Lakeway Plan at Riverwood Ranch
- Baxtor Plan at Riverwood Ranch
- 811 Buchta Rd
- 811 Buchta Rd Unit F
- 811 Buchta Rd Unit B
- 811 Buchta Rd Unit D
- 811 Buchta Rd Unit J
- 811 Buchta Rd Unit I
- 811 Buchta Rd Unit H
- 811 Buchta Rd Unit G
- 811 Buchta Rd Unit E
- 811 Buchta Rd Unit B
- 1313 Northview Dr
- 1309 Northbrook Dr
- 1321 Northbrook Dr
- 1305 Northbrook Dr
- 807 Buchta Rd
- 807 Buchta Rd
- 807 Buchta Rd Unit 13
- 807 Buchta Rd
- 807 Buchta Rd
- 807 Buchta Rd
Your Personal Tour Guide
Ask me questions while you tour the home.