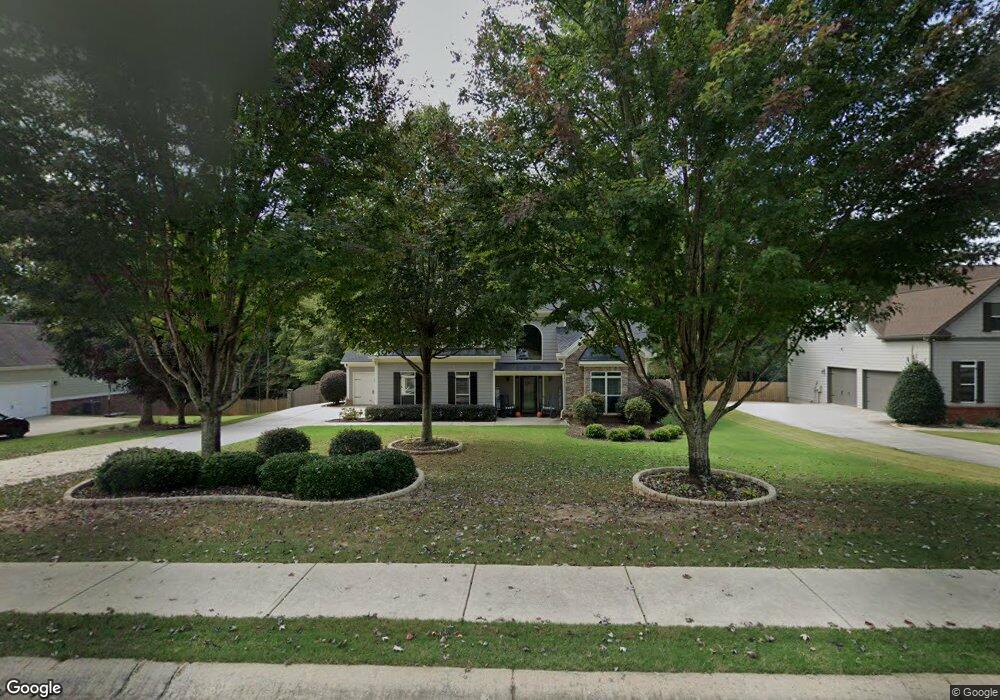
811 Caleb Dr Winder, GA 30680
Estimated Value: $409,613 - $484,000
Studio
3
Baths
2,531
Sq Ft
$182/Sq Ft
Est. Value
About This Home
This home is located at 811 Caleb Dr, Winder, GA 30680 and is currently estimated at $460,153, approximately $181 per square foot. 811 Caleb Dr is a home located in Barrow County with nearby schools including Bramlett Elementary School, Russell Middle School, and Winder-Barrow High School.
Ownership History
Date
Name
Owned For
Owner Type
Purchase Details
Closed on
Jun 29, 2017
Sold by
Battle Craig Michael
Bought by
Battle Craig Michael and Battle Jennifer
Current Estimated Value
Purchase Details
Closed on
May 16, 2014
Sold by
Wells Fargo Bank Na
Bought by
Battle Craig Michael
Home Financials for this Owner
Home Financials are based on the most recent Mortgage that was taken out on this home.
Original Mortgage
$142,800
Interest Rate
4.32%
Mortgage Type
New Conventional
Purchase Details
Closed on
Feb 4, 2014
Sold by
Miller Timothy J
Bought by
Wells Fargo Bank Na
Purchase Details
Closed on
Aug 25, 2006
Sold by
Star Hm Builders Inc
Bought by
Miller Timothy J and Miller Sue A
Home Financials for this Owner
Home Financials are based on the most recent Mortgage that was taken out on this home.
Original Mortgage
$198,000
Interest Rate
6.67%
Mortgage Type
New Conventional
Purchase Details
Closed on
Apr 7, 2005
Sold by
Montana Development Inc
Bought by
Star Home Builders Inc
Purchase Details
Closed on
Mar 4, 2004
Bought by
Montana Development Inc
Create a Home Valuation Report for This Property
The Home Valuation Report is an in-depth analysis detailing your home's value as well as a comparison with similar homes in the area
Home Values in the Area
Average Home Value in this Area
Purchase History
| Date | Buyer | Sale Price | Title Company |
|---|---|---|---|
| Battle Craig Michael | -- | -- | |
| Battle Craig Michael | $178,500 | -- | |
| Wells Fargo Bank Na | $149,986 | -- | |
| Miller Timothy J | $247,500 | -- | |
| Star Home Builders Inc | $45,000 | -- | |
| Montana Development Inc | -- | -- |
Source: Public Records
Mortgage History
| Date | Status | Borrower | Loan Amount |
|---|---|---|---|
| Previous Owner | Battle Craig Michael | $142,800 | |
| Previous Owner | Miller Timothy J | $198,000 |
Source: Public Records
Tax History
| Year | Tax Paid | Tax Assessment Tax Assessment Total Assessment is a certain percentage of the fair market value that is determined by local assessors to be the total taxable value of land and additions on the property. | Land | Improvement |
|---|---|---|---|---|
| 2025 | $3,545 | $151,682 | $33,600 | $118,082 |
| 2024 | $3,639 | $148,202 | $33,600 | $114,602 |
| 2023 | $3,232 | $148,802 | $33,600 | $115,202 |
| 2022 | $3,435 | $121,430 | $28,800 | $92,630 |
| 2021 | $2,945 | $98,360 | $18,000 | $80,360 |
| 2020 | $2,948 | $98,360 | $18,000 | $80,360 |
| 2019 | $2,999 | $98,360 | $18,000 | $80,360 |
| 2018 | $2,958 | $98,002 | $18,000 | $80,002 |
| 2017 | $2,315 | $79,505 | $18,000 | $61,505 |
| 2016 | $2,006 | $67,849 | $18,000 | $49,849 |
| 2015 | $2,032 | $68,390 | $18,000 | $50,390 |
| 2014 | $1,800 | $59,752 | $8,820 | $50,932 |
| 2013 | -- | $54,150 | $8,820 | $45,330 |
Source: Public Records
Map
Nearby Homes
- 1929 Windstone Place
- 103 Treemont Way
- 1224 Treemont Trace
- 1303 Windstone Ct
- 912 Westwood Ln
- 681 County Line Auburn Rd
- 604 Fox Run
- 629 Dee Kennedy Rd
- 903 Carl Bramlett Rd
- 1000 Jim Johnson Rd
- 262 Blake Ln
- 760 Highway 211 NW
- 807 Kenwood Ln
- 432 Mulberry Rd
- 206 Atlas Ln
- 181 Atlas Ln
- 687 Ansley Ct
- 193 Atlas Ln
- 218 Atlas Ln
- 211 Atlas Ln
- 809 Caleb Dr
- 815 Caleb Dr
- 808 Caleb Dr
- 807 Caleb Dr
- 54 Mcmillian Ct Unit 2
- 54 Mcmillian Ct
- 59 Mcmillian Ct
- 59 Mcmillian Ct Unit 29
- 81 Mcmillian Ct
- 81 Mcmillian Ct Unit 28
- 99 Mcmillian Ct Unit 27
- 812 Caleb Dr
- 819 Caleb Dr
- 814 Caleb Dr
- 805 Caleb Dr
- 804 Caleb Dr
- 101 Hamway Ln
- 821 Caleb Dr
- 102 Hamway Ln
- 803 Caleb Dr
Your Personal Tour Guide
Ask me questions while you tour the home.