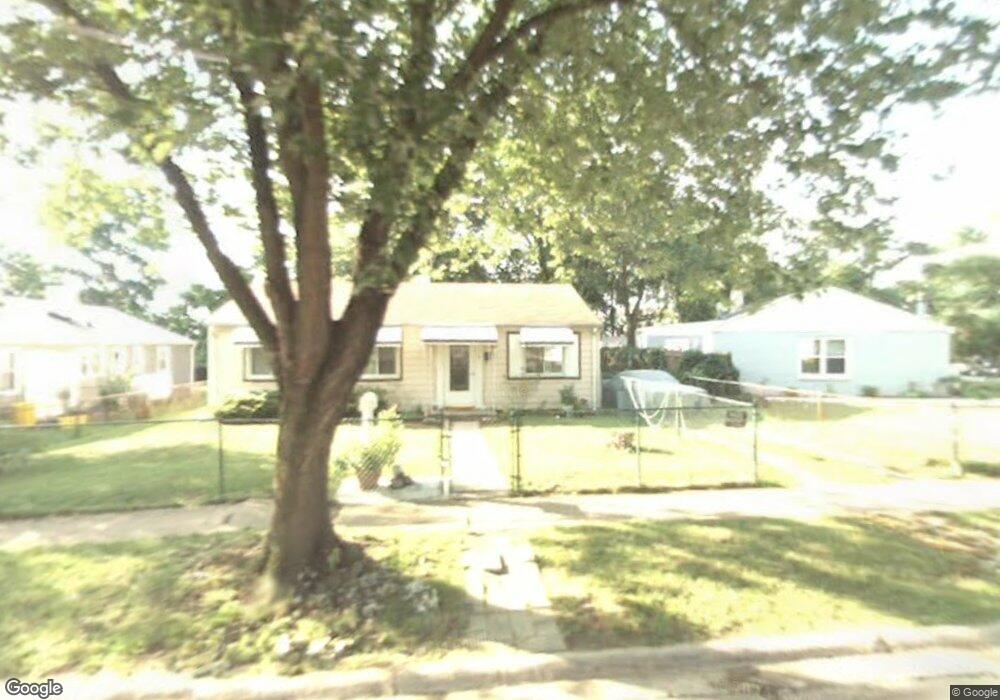
811 Castle Rd Glen Burnie, MD 21061
Estimated Value: $329,000 - $367,000
--
Bed
1
Bath
1,244
Sq Ft
$283/Sq Ft
Est. Value
About This Home
This home is located at 811 Castle Rd, Glen Burnie, MD 21061 and is currently estimated at $351,436, approximately $282 per square foot. 811 Castle Rd is a home located in Anne Arundel County with nearby schools including Woodside Elementary School, Corkran Middle School, and Glen Burnie High School.
Ownership History
Date
Name
Owned For
Owner Type
Purchase Details
Closed on
Oct 5, 2000
Sold by
Secretary Of Housing & Urban
Bought by
Padgett Jeff and Padgett Sheryl
Current Estimated Value
Purchase Details
Closed on
Aug 2, 2000
Sold by
Guerrero Esminiano M
Bought by
Secretary Of Housing & Urban and Development
Purchase Details
Closed on
Aug 4, 1993
Sold by
Cockey S M
Bought by
Guerrero E M
Home Financials for this Owner
Home Financials are based on the most recent Mortgage that was taken out on this home.
Original Mortgage
$94,600
Interest Rate
7.29%
Purchase Details
Closed on
Jul 19, 1993
Sold by
Cockey Sharon M
Bought by
Guerrero Esminiano M
Home Financials for this Owner
Home Financials are based on the most recent Mortgage that was taken out on this home.
Original Mortgage
$94,600
Interest Rate
7.29%
Create a Home Valuation Report for This Property
The Home Valuation Report is an in-depth analysis detailing your home's value as well as a comparison with similar homes in the area
Home Values in the Area
Average Home Value in this Area
Purchase History
| Date | Buyer | Sale Price | Title Company |
|---|---|---|---|
| Padgett Jeff | $90,000 | -- | |
| Secretary Of Housing & Urban | $95,000 | -- | |
| Guerrero E M | $94,000 | -- | |
| Guerrero Esminiano M | $94,000 | -- |
Source: Public Records
Mortgage History
| Date | Status | Borrower | Loan Amount |
|---|---|---|---|
| Previous Owner | Guerrero E M | $94,600 | |
| Previous Owner | Guerrero Esminiano M | $94,600 |
Source: Public Records
Tax History Compared to Growth
Tax History
| Year | Tax Paid | Tax Assessment Tax Assessment Total Assessment is a certain percentage of the fair market value that is determined by local assessors to be the total taxable value of land and additions on the property. | Land | Improvement |
|---|---|---|---|---|
| 2025 | $1,990 | $233,700 | $143,100 | $90,600 |
| 2024 | $1,990 | $219,967 | $0 | $0 |
| 2023 | $1,918 | $206,233 | $0 | $0 |
| 2022 | $1,778 | $192,500 | $113,100 | $79,400 |
| 2021 | $3,503 | $188,467 | $0 | $0 |
| 2020 | $1,683 | $184,433 | $0 | $0 |
| 2019 | $1,659 | $180,400 | $103,100 | $77,300 |
| 2018 | $1,759 | $173,467 | $0 | $0 |
| 2017 | $1,567 | $166,533 | $0 | $0 |
| 2016 | -- | $159,600 | $0 | $0 |
| 2015 | -- | $151,700 | $0 | $0 |
| 2014 | -- | $143,800 | $0 | $0 |
Source: Public Records
Map
Nearby Homes