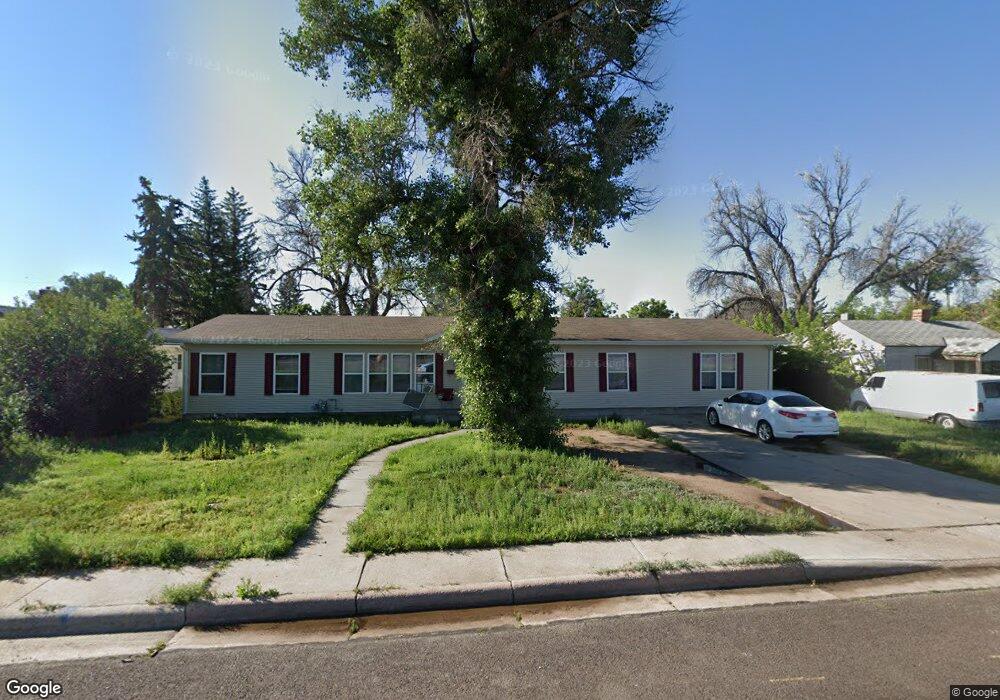
811 E 10th St Cheyenne, WY 82007
South Cheyenne NeighborhoodEstimated Value: $312,622 - $353,000
Studio
--
Bath
2,204
Sq Ft
$148/Sq Ft
Est. Value
About This Home
This home is located at 811 E 10th St, Cheyenne, WY 82007 and is currently estimated at $326,156, approximately $147 per square foot. 811 E 10th St is a home located in Laramie County with nearby schools including Hebard Elementary School, Johnson Junior High School, and South High School.
Ownership History
Date
Name
Owned For
Owner Type
Purchase Details
Closed on
Aug 30, 2016
Sold by
Glick Danny
Bought by
Homeceptional Properties Llc
Current Estimated Value
Purchase Details
Closed on
Apr 20, 2004
Sold by
Abeyta Dominic P
Bought by
Abeyta Dominic P and Manzanares Andrea
Home Financials for this Owner
Home Financials are based on the most recent Mortgage that was taken out on this home.
Original Mortgage
$117,232
Interest Rate
5.42%
Mortgage Type
Stand Alone Refi Refinance Of Original Loan
Purchase Details
Closed on
Feb 26, 2004
Sold by
Pendleton Rebecca D and Martinez Lorraine G
Bought by
Abeyta Dominic P
Home Financials for this Owner
Home Financials are based on the most recent Mortgage that was taken out on this home.
Original Mortgage
$117,232
Interest Rate
5.42%
Mortgage Type
Stand Alone Refi Refinance Of Original Loan
Purchase Details
Closed on
Feb 18, 2004
Sold by
Martinez Kathrine
Bought by
Abeyta Dominic P
Purchase Details
Closed on
Dec 16, 2003
Sold by
Abeyts Henry
Bought by
Abeyta Dominic P
Create a Home Valuation Report for This Property
The Home Valuation Report is an in-depth analysis detailing your home's value as well as a comparison with similar homes in the area
Home Values in the Area
Average Home Value in this Area
Purchase History
| Date | Buyer | Sale Price | Title Company |
|---|---|---|---|
| Homeceptional Properties Llc | $114,075 | None Available | |
| Abeyta Dominic P | -- | -- | |
| Abeyta Dominic P | -- | -- | |
| Abeyta Dominic P | -- | -- | |
| Abeyta Dominic P | -- | -- |
Source: Public Records
Mortgage History
| Date | Status | Borrower | Loan Amount |
|---|---|---|---|
| Previous Owner | Abeyta Dominic P | $117,232 |
Source: Public Records
Tax History
| Year | Tax Paid | Tax Assessment Tax Assessment Total Assessment is a certain percentage of the fair market value that is determined by local assessors to be the total taxable value of land and additions on the property. | Land | Improvement |
|---|---|---|---|---|
| 2025 | $2,104 | $23,128 | $1,990 | $21,138 |
| 2024 | $2,104 | $29,752 | $2,653 | $27,099 |
| 2023 | $2,047 | $28,943 | $2,653 | $26,290 |
| 2022 | $2,063 | $28,588 | $4,722 | $23,866 |
| 2021 | $1,904 | $26,323 | $4,722 | $21,601 |
| 2020 | $1,703 | $23,611 | $4,722 | $18,889 |
| 2019 | $1,634 | $22,638 | $4,722 | $17,916 |
| 2018 | $1,454 | $20,323 | $3,908 | $16,415 |
| 2017 | $1,388 | $19,226 | $2,958 | $16,268 |
| 2016 | $1,352 | $18,730 | $2,699 | $16,031 |
| 2015 | $1,370 | $18,965 | $2,699 | $16,266 |
| 2014 | $1,384 | $19,043 | $2,732 | $16,311 |
Source: Public Records
Map
Nearby Homes
- 615 E 6th St
- 1212 E 7th St
- 714 E 15th St
- 701 E Lincolnway
- 516 E 4th St
- 807 E 3rd St
- 306 Evans Ave
- 600 Central Ave
- 2119 E 11th St
- 2107 E 12th St
- 1605 E 16th St
- 1818 Evans Ave Unit 109
- 306 E 18th St Unit 102
- 306 E 18th St Unit 307
- 614 Broken Wheel Ct
- TBD U S 30
- TBD Deming Dr
- 1510 Seymour Ave
- TBD W 9th St
- 1503 E 19th St
Your Personal Tour Guide
Ask me questions while you tour the home.