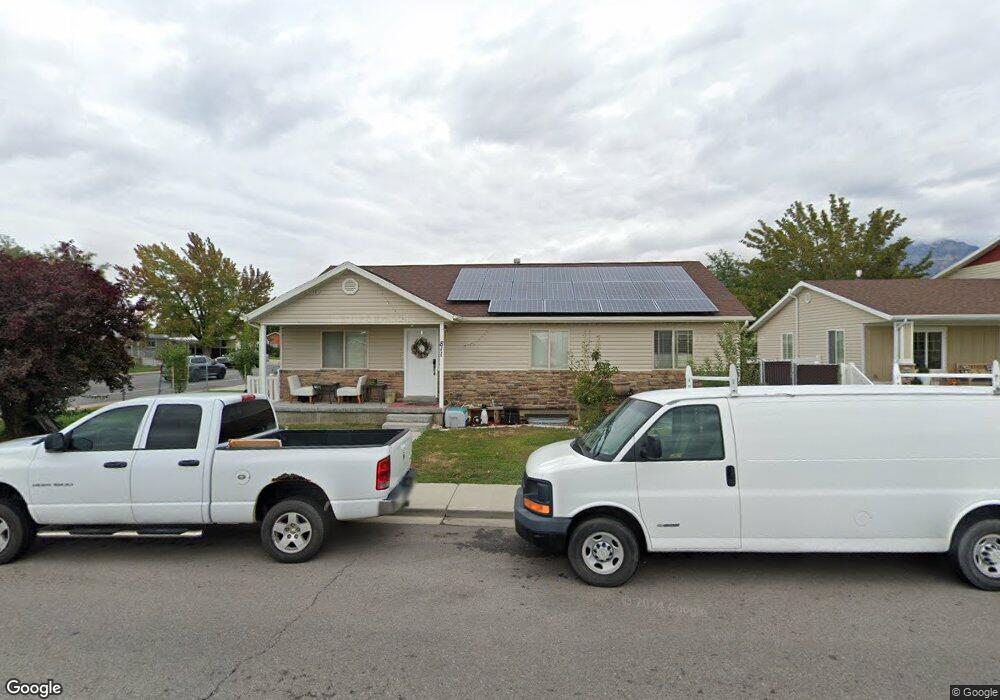
811 E 200 N Orem, UT 84097
Cascade NeighborhoodEstimated Value: $590,000 - $601,629
3
Beds
3
Baths
2,812
Sq Ft
$212/Sq Ft
Est. Value
About This Home
This home is located at 811 E 200 N, Orem, UT 84097 and is currently estimated at $597,210, approximately $212 per square foot. 811 E 200 N is a home located in Utah County with nearby schools including Cascade Elementary School, Canyon View Junior High School, and Orem High School.
Ownership History
Date
Name
Owned For
Owner Type
Purchase Details
Closed on
Jul 28, 2006
Sold by
Ryan Angeline
Bought by
Flores Andres
Current Estimated Value
Purchase Details
Closed on
Aug 21, 2002
Sold by
Jordan Roger F and Jordan Carene C
Bought by
Ryan Angeline
Home Financials for this Owner
Home Financials are based on the most recent Mortgage that was taken out on this home.
Original Mortgage
$155,135
Interest Rate
6.52%
Mortgage Type
FHA
Create a Home Valuation Report for This Property
The Home Valuation Report is an in-depth analysis detailing your home's value as well as a comparison with similar homes in the area
Home Values in the Area
Average Home Value in this Area
Purchase History
| Date | Buyer | Sale Price | Title Company |
|---|---|---|---|
| Flores Andres | -- | Access Title Company | |
| Ryan Angeline | -- | Old Republic Title |
Source: Public Records
Mortgage History
| Date | Status | Borrower | Loan Amount |
|---|---|---|---|
| Previous Owner | Ryan Angeline | $155,135 |
Source: Public Records
Tax History
| Year | Tax Paid | Tax Assessment Tax Assessment Total Assessment is a certain percentage of the fair market value that is determined by local assessors to be the total taxable value of land and additions on the property. | Land | Improvement |
|---|---|---|---|---|
| 2025 | $2,498 | $330,495 | -- | -- |
| 2024 | $2,498 | $305,470 | $0 | $0 |
| 2023 | $2,329 | $306,075 | $0 | $0 |
| 2022 | $2,354 | $299,695 | $0 | $0 |
| 2021 | $2,027 | $391,000 | $146,600 | $244,400 |
| 2020 | $1,883 | $356,900 | $117,300 | $239,600 |
| 2019 | $1,703 | $335,700 | $106,900 | $228,800 |
| 2018 | $1,685 | $317,300 | $103,500 | $213,800 |
| 2017 | $1,654 | $166,870 | $0 | $0 |
| 2016 | $1,592 | $148,060 | $0 | $0 |
| 2015 | $1,630 | $143,385 | $0 | $0 |
| 2014 | -- | $135,850 | $0 | $0 |
Source: Public Records
Map
Nearby Homes
Your Personal Tour Guide
Ask me questions while you tour the home.