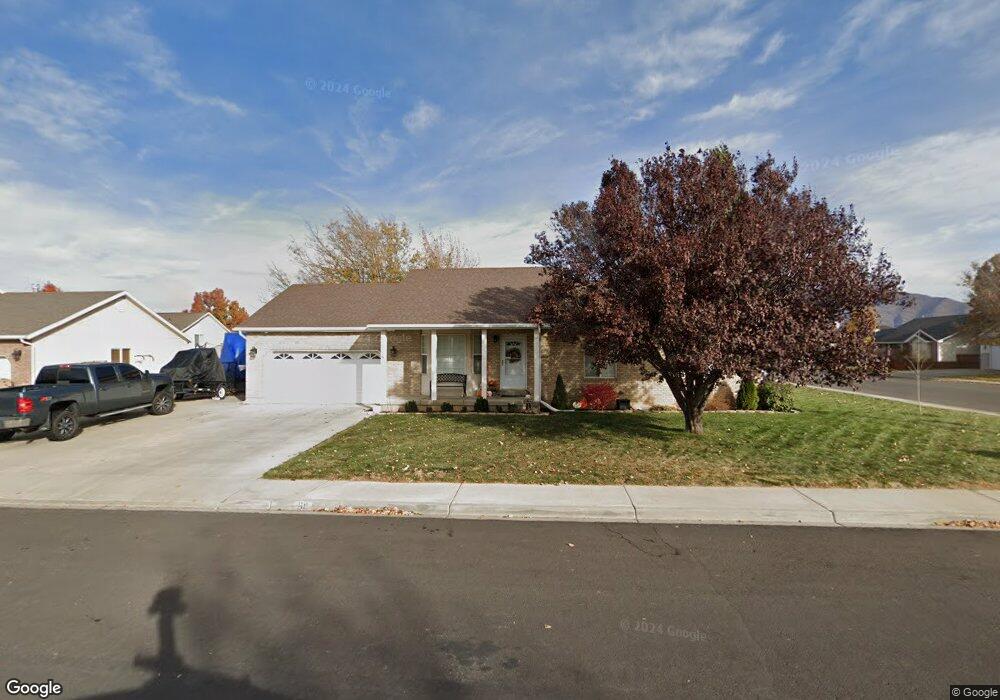
811 E 820 S Spanish Fork, UT 84660
Estimated Value: $487,000 - $548,000
3
Beds
2
Baths
2,756
Sq Ft
$185/Sq Ft
Est. Value
About This Home
This home is located at 811 E 820 S, Spanish Fork, UT 84660 and is currently estimated at $510,970, approximately $185 per square foot. 811 E 820 S is a home located in Utah County with nearby schools including Canyon Elementary School, Spanish Fork Jr High School, and Spanish Fork High School.
Ownership History
Date
Name
Owned For
Owner Type
Purchase Details
Closed on
Dec 29, 2020
Sold by
Sorensen Shaen T and Sorensen Tiffany T
Bought by
Sorensen Shaen T and Sorensen Tiffany T
Current Estimated Value
Home Financials for this Owner
Home Financials are based on the most recent Mortgage that was taken out on this home.
Original Mortgage
$329,344
Outstanding Balance
$293,889
Interest Rate
2.7%
Mortgage Type
VA
Estimated Equity
$217,081
Purchase Details
Closed on
Jul 20, 2018
Sold by
Mason James A and Mason Carol A
Bought by
Sorensen Shane T and Sorensen Tiffany T
Home Financials for this Owner
Home Financials are based on the most recent Mortgage that was taken out on this home.
Original Mortgage
$296,235
Interest Rate
4.5%
Mortgage Type
VA
Create a Home Valuation Report for This Property
The Home Valuation Report is an in-depth analysis detailing your home's value as well as a comparison with similar homes in the area
Home Values in the Area
Average Home Value in this Area
Purchase History
| Date | Buyer | Sale Price | Title Company |
|---|---|---|---|
| Sorensen Shaen T | -- | Gt Title Services | |
| Sorensen Shane T | -- | Inwest Title |
Source: Public Records
Mortgage History
| Date | Status | Borrower | Loan Amount |
|---|---|---|---|
| Open | Sorensen Shaen T | $329,344 | |
| Closed | Sorensen Shane T | $296,235 |
Source: Public Records
Tax History Compared to Growth
Tax History
| Year | Tax Paid | Tax Assessment Tax Assessment Total Assessment is a certain percentage of the fair market value that is determined by local assessors to be the total taxable value of land and additions on the property. | Land | Improvement |
|---|---|---|---|---|
| 2025 | $2,250 | $251,460 | $183,400 | $273,800 |
| 2024 | $2,250 | $231,880 | $0 | $0 |
| 2023 | $2,296 | $236,885 | $0 | $0 |
| 2022 | $2,334 | $236,225 | $0 | $0 |
| 2021 | $1,985 | $321,300 | $109,600 | $211,700 |
| 2020 | $1,878 | $295,600 | $99,600 | $196,000 |
| 2019 | $1,697 | $281,100 | $85,100 | $196,000 |
| 2018 | $1,573 | $251,800 | $78,000 | $173,800 |
| 2017 | $1,510 | $129,965 | $0 | $0 |
| 2016 | $1,333 | $113,135 | $0 | $0 |
| 2015 | $1,274 | $106,865 | $0 | $0 |
| 2014 | $1,152 | $97,020 | $0 | $0 |
Source: Public Records
Map
Nearby Homes