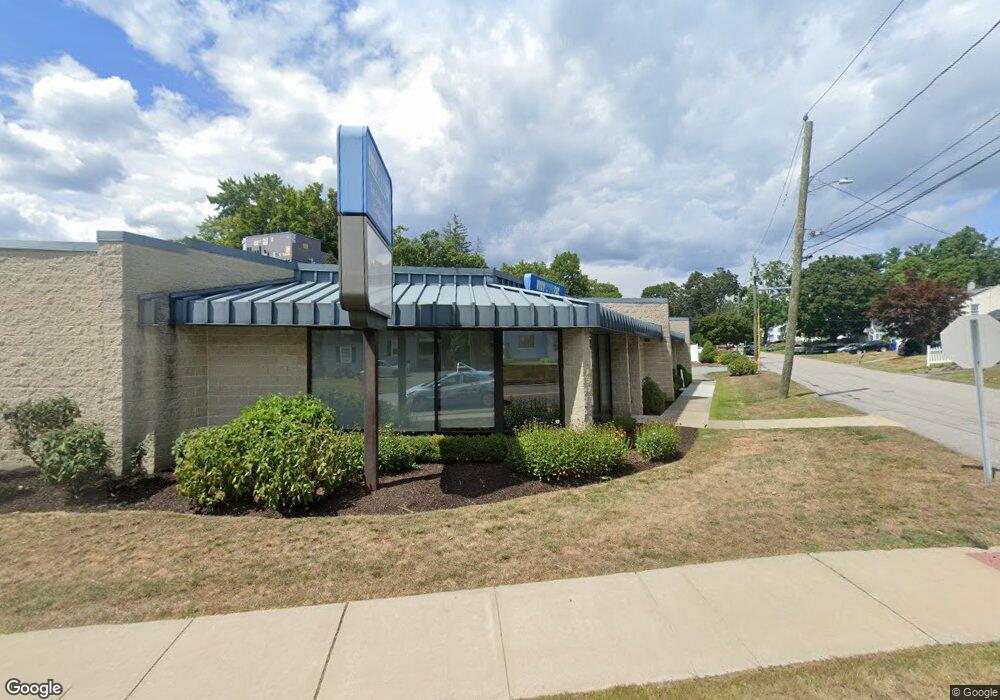
811 E Main St Unit B Torrington, CT 06790
Estimated Value: $3,128,273
Studio
--
Bath
4,427
Sq Ft
$707/Sq Ft
Est. Value
About This Home
This home is located at 811 E Main St Unit B, Torrington, CT 06790 and is currently estimated at $3,128,273, approximately $706 per square foot. 811 E Main St Unit B is a home located in Litchfield County with nearby schools including Torrington Middle School, Torrington High School, and Torrington Christian Academy.
Ownership History
Date
Name
Owned For
Owner Type
Purchase Details
Closed on
Apr 2, 2019
Sold by
Bauborg Assoc Llc
Bought by
Dw Realties Llc
Current Estimated Value
Home Financials for this Owner
Home Financials are based on the most recent Mortgage that was taken out on this home.
Original Mortgage
$1,142,568
Outstanding Balance
$1,004,520
Interest Rate
4.3%
Mortgage Type
Purchase Money Mortgage
Estimated Equity
$2,123,753
Purchase Details
Closed on
Sep 2, 1987
Sold by
Ocain John
Bought by
Meneguzzo Charles J
Home Financials for this Owner
Home Financials are based on the most recent Mortgage that was taken out on this home.
Original Mortgage
$156,000
Interest Rate
10.28%
Mortgage Type
Commercial
Create a Home Valuation Report for This Property
The Home Valuation Report is an in-depth analysis detailing your home's value as well as a comparison with similar homes in the area
Home Values in the Area
Average Home Value in this Area
Purchase History
| Date | Buyer | Sale Price | Title Company |
|---|---|---|---|
| Dw Realties Llc | $1,428,210 | -- | |
| Dw Realties Llc | $1,428,210 | -- | |
| Meneguzzo Charles J | $225,000 | -- |
Source: Public Records
Mortgage History
| Date | Status | Borrower | Loan Amount |
|---|---|---|---|
| Open | Dw Realties Llc | $1,142,568 | |
| Closed | Dw Realties Llc | $1,142,568 | |
| Previous Owner | Meneguzzo Charles J | $156,000 | |
| Previous Owner | Meneguzzo Charles J | $95,000 |
Source: Public Records
Tax History
| Year | Tax Paid | Tax Assessment Tax Assessment Total Assessment is a certain percentage of the fair market value that is determined by local assessors to be the total taxable value of land and additions on the property. | Land | Improvement |
|---|---|---|---|---|
| 2025 | $36,349 | $945,350 | $98,560 | $846,790 |
| 2024 | $23,515 | $490,210 | $65,090 | $425,120 |
| 2023 | $23,510 | $490,210 | $65,090 | $425,120 |
| 2022 | $23,108 | $490,210 | $65,090 | $425,120 |
| 2021 | $22,633 | $490,210 | $65,090 | $425,120 |
| 2020 | $22,633 | $490,210 | $65,090 | $425,120 |
| 2019 | $14,574 | $315,660 | $62,690 | $252,970 |
| 2018 | $14,574 | $315,660 | $62,690 | $252,970 |
| 2017 | $14,441 | $315,660 | $62,690 | $252,970 |
| 2016 | $14,441 | $315,660 | $62,690 | $252,970 |
| 2015 | $14,441 | $315,660 | $62,690 | $252,970 |
| 2014 | $14,035 | $386,430 | $85,070 | $301,360 |
Source: Public Records
Map
Nearby Homes
- 125 Tioga St
- 42 Harpswell St
- 121 Yorkshire St
- 106 Hartford Ave
- 177 Lisle St Unit 5
- 195 Torrington Heights Rd
- 65 Garden St
- 88 Elmira Ave
- 483 Charles St
- 55 Barton St
- 0 Torringford St W
- 116 Hillside Ave
- 116 Fairlawn Dr
- 271 Meadowview Dr
- 279 E Elm St
- 277 Brightwood Ave
- 409 Brightwood Ave
- 291 E Main St
- 68 Knollwood Dr
- 71 Doman Dr
Your Personal Tour Guide
Ask me questions while you tour the home.