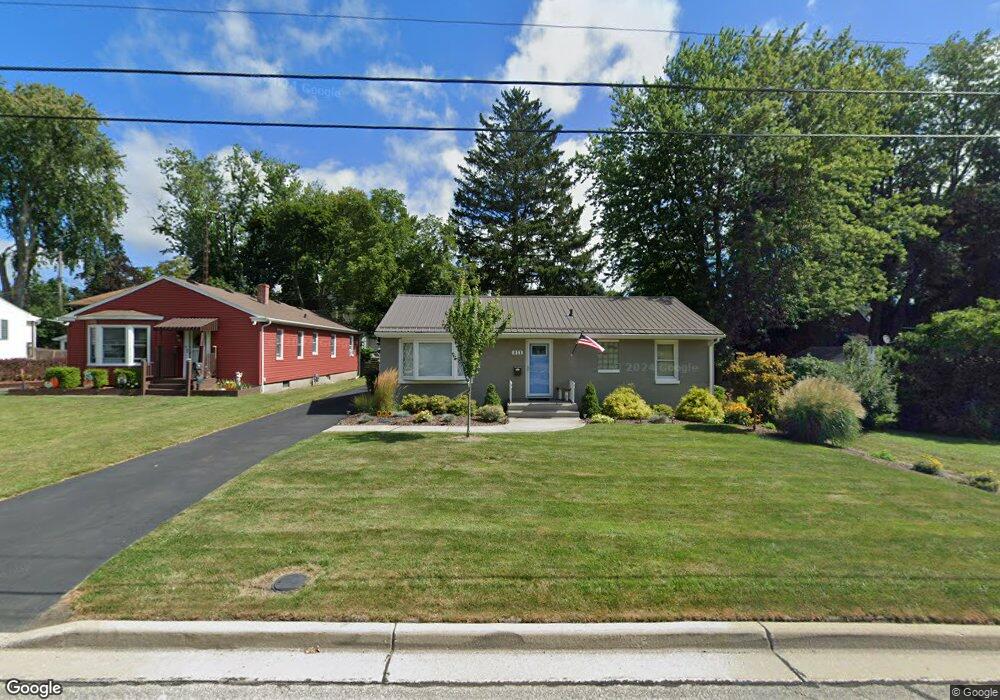
811 Fox St La Porte, IN 46350
Estimated Value: $172,000 - $201,000
3
Beds
2
Baths
1,058
Sq Ft
$178/Sq Ft
Est. Value
About This Home
This home is located at 811 Fox St, La Porte, IN 46350 and is currently estimated at $188,192, approximately $177 per square foot. 811 Fox St is a home located in LaPorte County with nearby schools including Dunkerton Elementary School, Handley Elementary School, and La Porte High School.
Ownership History
Date
Name
Owned For
Owner Type
Purchase Details
Closed on
Sep 4, 2014
Sold by
Jackson Roger W
Bought by
Jackson Roger W and Jackson Cynthia
Current Estimated Value
Purchase Details
Closed on
Nov 16, 2011
Sold by
Jackson Elizabeth A
Bought by
Jackson Roger W
Create a Home Valuation Report for This Property
The Home Valuation Report is an in-depth analysis detailing your home's value as well as a comparison with similar homes in the area
Home Values in the Area
Average Home Value in this Area
Purchase History
| Date | Buyer | Sale Price | Title Company |
|---|---|---|---|
| Jackson Roger W | -- | None Available | |
| Jackson Roger W | -- | None Available |
Source: Public Records
Tax History Compared to Growth
Tax History
| Year | Tax Paid | Tax Assessment Tax Assessment Total Assessment is a certain percentage of the fair market value that is determined by local assessors to be the total taxable value of land and additions on the property. | Land | Improvement |
|---|---|---|---|---|
| 2024 | $1,293 | $132,600 | $15,500 | $117,100 |
| 2023 | $1,214 | $121,400 | $12,900 | $108,500 |
| 2022 | $1,105 | $110,500 | $12,900 | $97,600 |
| 2021 | $1,046 | $104,600 | $12,900 | $91,700 |
| 2020 | $1,203 | $104,600 | $12,900 | $91,700 |
| 2019 | $1,265 | $101,800 | $15,900 | $85,900 |
| 2018 | $1,150 | $93,300 | $14,000 | $79,300 |
| 2017 | $1,005 | $88,500 | $14,000 | $74,500 |
| 2016 | $796 | $82,900 | $13,400 | $69,500 |
| 2014 | $605 | $76,200 | $13,400 | $62,800 |
Source: Public Records
Map
Nearby Homes
- 1603 Indiana Ave
- 827 Eason Ct
- 129 Kingsbury Ave
- 106 Franklin Ct
- 2010 Monroe St
- 1105 A St
- 710 John St
- 308 Warwick St
- 1524 Monroe St
- 502 A St
- 1210 Indiana Ave
- 1312 Michigan Ave
- 204 W 12th St
- 2209 Woodlawn Dr
- 112 W 13th St
- 207 Mccollum St
- 1132 Indiana Ave
- 1401 Rumely St
- 0 1st St Unit NRA542339
- 602 D St