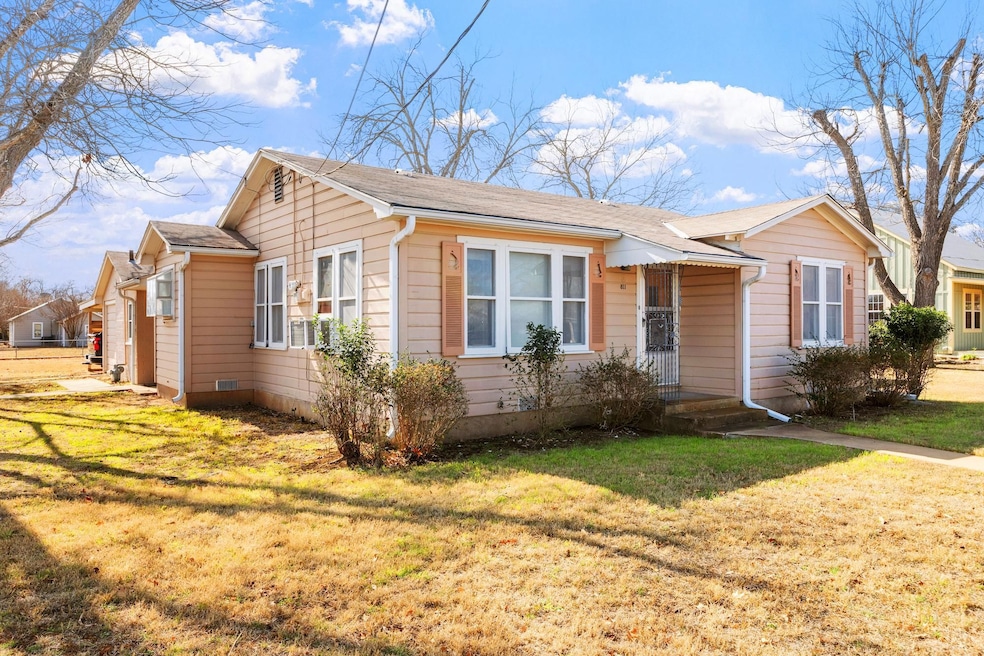
811 Franklin St Fredericksburg, TX 78624
Estimated payment $2,688/month
About This Lot
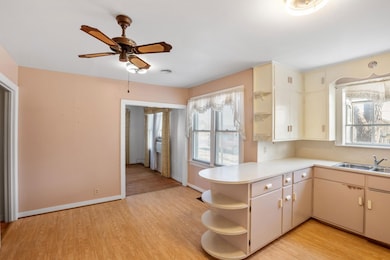
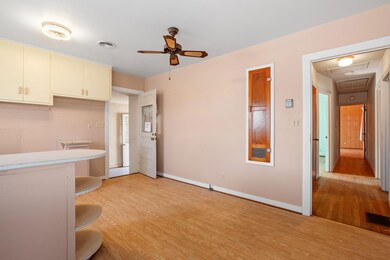
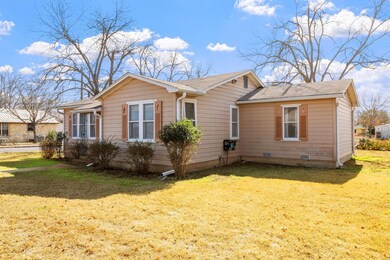
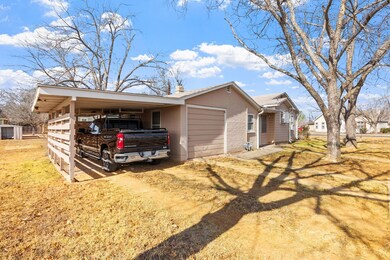
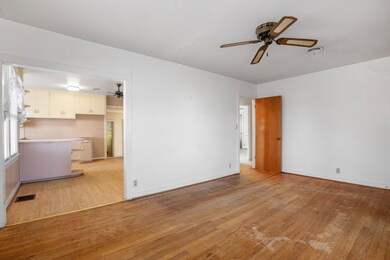
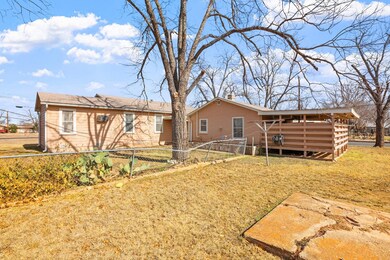
An interesting property that can have multiple uses and opportunities. GCAD states it was built in 1950, likely that is for what is the majority of the pier/beam part of the home. Apparently the southern end of the home was built prior to that and consisted of a kitchen, bath and a bedroom using brick construction and is now adjoined to the main home via a breezeway. Home needs remodeling, would be easy to reconfigure into a 2/2 by utilizing one bedroom as a bath/closet conversion. Bedrooms & living area have beautiful oak flooring. Has central heat, just needs compressor for AC. Corner location and 2 lots allow it to be redeveloped, add another home and since it is R-2 zoning you could live in one and STR the other or sell the lot you didn't want to utilize. There is no historical significance rating by City so demo is not an issue. Potential is here, bring your vision and re-imagine this long time family home. Location is just south of the area where the re-development of Navajo Grill complex is.

Property Details
Property Type
- Land
Est. Annual Taxes
- $5,464
Map
Home Values in the Area
Average Home Value in this Area
Tax History
| Year | Tax Paid | Tax Assessment Tax Assessment Total Assessment is a certain percentage of the fair market value that is determined by local assessors to be the total taxable value of land and additions on the property. | Land | Improvement |
|---|---|---|---|---|
| 2024 | $5,464 | $438,250 | $196,500 | $241,750 |
| 2023 | $5,412 | $441,780 | $196,500 | $245,280 |
| 2022 | $4,571 | $346,670 | $109,500 | $237,170 |
| 2021 | $4,690 | $297,640 | $91,050 | $206,590 |
| 2020 | $4,353 | $252,750 | $72,750 | $180,000 |
| 2019 | $4,158 | $252,750 | $72,750 | $180,000 |
| 2018 | $3,763 | $261,460 | $67,800 | $193,660 |
| 2017 | $3,516 | $239,520 | $67,800 | $171,720 |
| 2016 | $3,197 | $182,870 | $67,800 | $115,070 |
| 2015 | -- | $169,570 | $61,950 | $107,620 |
| 2014 | -- | $144,490 | $38,850 | $105,640 |
Property History
| Date | Event | Price | Change | Sq Ft Price |
|---|---|---|---|---|
| 05/01/2025 05/01/25 | Price Changed | $399,000 | -4.8% | $287 / Sq Ft |
| 03/15/2025 03/15/25 | Price Changed | $419,000 | -4.6% | $301 / Sq Ft |
| 01/15/2025 01/15/25 | For Sale | $439,000 | -- | $316 / Sq Ft |
- 903 Franklin St
- 802 Bell St
- 901 Bell St
- 907 Bell St
- Lot 11R Mesquite St Unit 11R
- 915 Bell St
- 907 Apple St
- 501 S Pear St
- 406 S Columbus St
- 902 E Highway St
- 485 Ranch To Market Road 1631
- 502 S Eagle St Unit 302
- 108 E Austin St Unit 377
- 203 S Creek St
- 507 S Creek St
- 1006 E Highway St
- 607 S Columbus St
- 204 Skylark Dr
- 204 Forest Trail Dr
- 1201 Crenwelge Dr
- 508 S Pear St
- 510 S Olive St
- 604 S Eagle St
- 707 S Creek St
- 202 E Ufer St
- 113 W Creek St
- 1125 S Adams St
- 209 W Hackberry St
- 804 N Orange St
- 306 W Burbank St
- 108 E Lower Crabapple Rd
- 619 W Live Oak St
- 305 Rose St
- 112 Broadmoor St
- 175 Friendship Ln
- 813 N Edison St
- 803 N Bowie St
- 107 Crestwood Dr
- 224 Riley Ln
- 724 Grace Ln