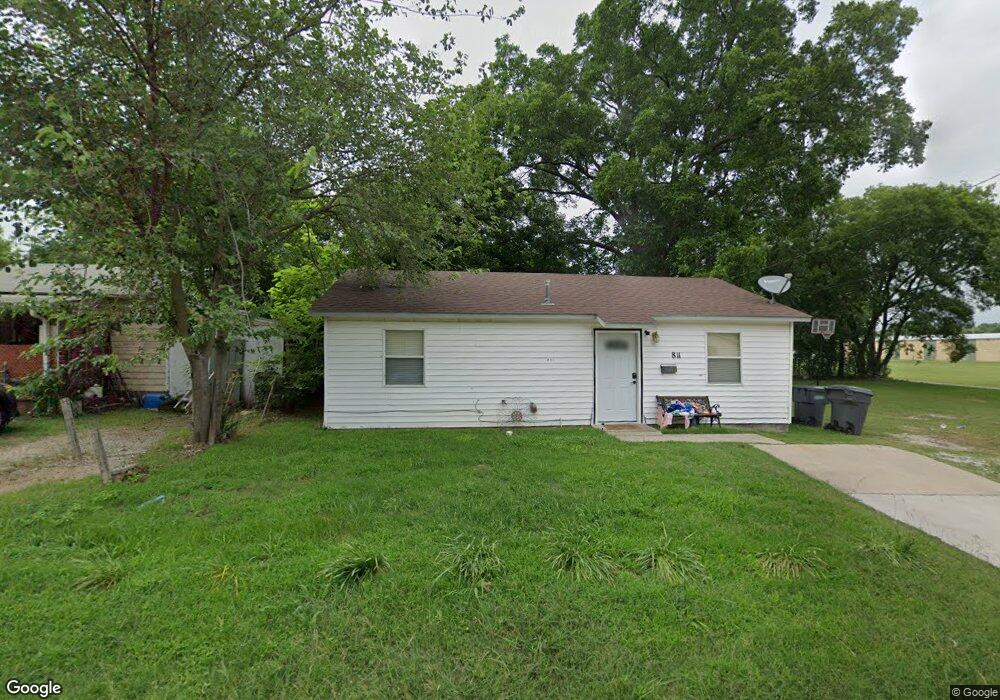
811 G St SW Ardmore, OK 73401
Estimated Value: $91,000 - $111,000
2
Beds
1
Bath
910
Sq Ft
$107/Sq Ft
Est. Value
About This Home
This home is located at 811 G St SW, Ardmore, OK 73401 and is currently estimated at $97,599, approximately $107 per square foot. 811 G St SW is a home located in Carter County with nearby schools including Lincoln Elementary School, Ardmore Middle School, and Ardmore High School.
Ownership History
Date
Name
Owned For
Owner Type
Purchase Details
Closed on
Dec 6, 2024
Sold by
Enriquez Heliodoro
Bought by
Jimenez Maria De Jesus
Current Estimated Value
Purchase Details
Closed on
May 24, 2024
Sold by
Enriquez Heliodoro and Enriquez Karll
Bought by
Enriquez Heliodoro
Purchase Details
Closed on
Apr 1, 2022
Sold by
Enriquez and Karli
Bought by
Hawken Gary and Hawken Cheryl
Home Financials for this Owner
Home Financials are based on the most recent Mortgage that was taken out on this home.
Original Mortgage
$35,505
Interest Rate
3.83%
Purchase Details
Closed on
May 14, 2015
Sold by
Briceno Abraham Enriquez and Enriquez Lilla B
Bought by
Enriquez Heliodoro and Enriquez Karli
Purchase Details
Closed on
May 4, 2007
Sold by
Hughes J T and Roberts Nora Dean
Bought by
Luna Armando Graciano
Purchase Details
Closed on
Nov 1, 1996
Sold by
Brewster James G
Bought by
Hughes Danial and Hughes Billie
Purchase Details
Closed on
Oct 25, 1996
Sold by
Meadows Ann
Bought by
Brewster James G
Create a Home Valuation Report for This Property
The Home Valuation Report is an in-depth analysis detailing your home's value as well as a comparison with similar homes in the area
Home Values in the Area
Average Home Value in this Area
Purchase History
| Date | Buyer | Sale Price | Title Company |
|---|---|---|---|
| Jimenez Maria De Jesus | -- | None Listed On Document | |
| Enriquez Heliodoro | -- | None Listed On Document | |
| Hawken Gary | -- | None Listed On Document | |
| Enriquez Heliodoro | $18,000 | None Available | |
| Luna Armando Graciano | $5,000 | -- | |
| Hughes Danial | -- | -- | |
| Brewster James G | $4,000 | -- |
Source: Public Records
Mortgage History
| Date | Status | Borrower | Loan Amount |
|---|---|---|---|
| Previous Owner | Hawken Gary | $35,505 |
Source: Public Records
Tax History Compared to Growth
Tax History
| Year | Tax Paid | Tax Assessment Tax Assessment Total Assessment is a certain percentage of the fair market value that is determined by local assessors to be the total taxable value of land and additions on the property. | Land | Improvement |
|---|---|---|---|---|
| 2024 | $623 | $5,947 | $634 | $5,313 |
| 2023 | $594 | $5,664 | $522 | $5,142 |
| 2022 | $516 | $5,395 | $407 | $4,988 |
| 2021 | $518 | $5,137 | $297 | $4,840 |
| 2020 | $487 | $4,893 | $269 | $4,624 |
| 2019 | $452 | $4,660 | $456 | $4,204 |
| 2018 | $438 | $4,439 | $138 | $4,301 |
| 2017 | $386 | $4,226 | $129 | $4,097 |
| 2016 | $375 | $4,026 | $120 | $3,906 |
| 2015 | $294 | $3,833 | $124 | $3,709 |
| 2014 | $327 | $3,651 | $110 | $3,541 |
Source: Public Records
Map
Nearby Homes